NFP Shock: +57K Jobs, Yet the Fed Stays Hawkish

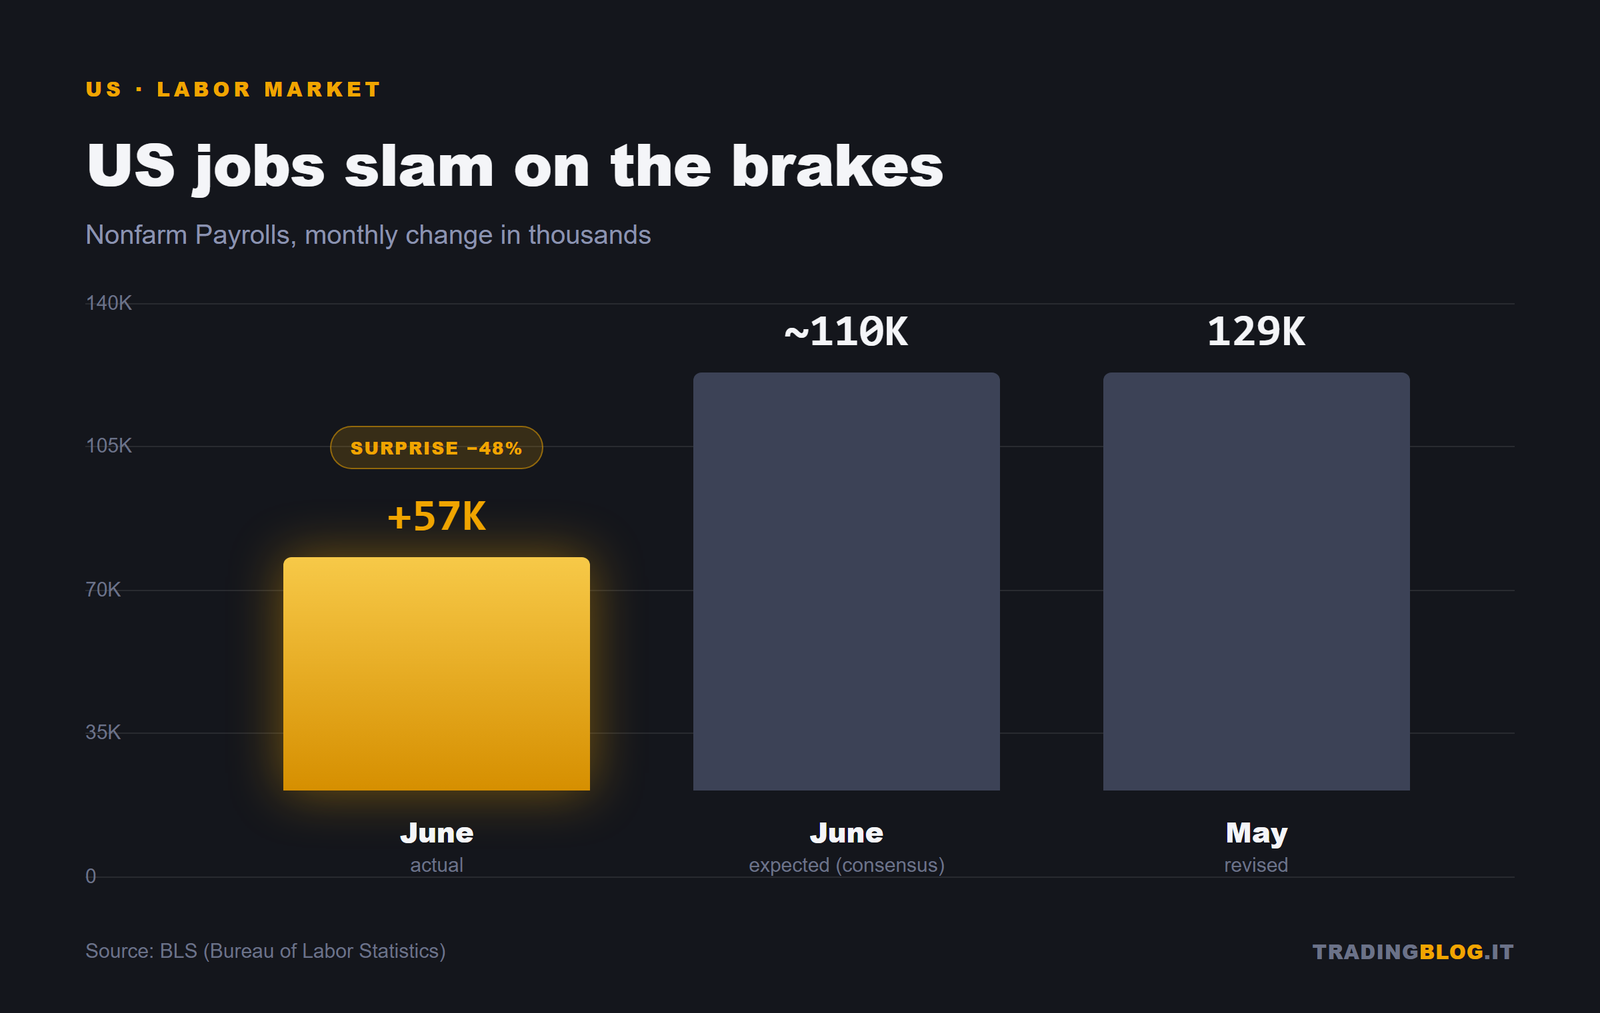
The first Friday of the month dropped its bomb, right on cue. But this time the number came in so low it looked like a typo: +57 thousand non-farm payrolls in the United States in June, against roughly 110 thousand expected. A little more than half. And if this were any old 2020, the market would already have priced in three cuts and a standing ovation for the doves.
Except this isn’t that world. We’re in the 2026 of great dissonance: the Fed is in restrictive mode, has just raised the bar on expected rates, and a weak jobs print isn’t enough to bend it. Let’s rebuild the chain, one link at a time.
The data: a labor market braking hard
Let’s start with the raw numbers. The Bureau of Labor Statistics reported +57K payrolls in June. May was revised down to 129K, and the combined April-May revision erased 74 thousand jobs we thought existed. Translated: the employment picture of recent weeks was more fragile than we thought.
Wages? Hourly earnings at +0.3% month over month and +3.5% year over year. Not a collapse, but not the wage pressure that terrifies a central bank either. The slowdown is there, and it’s tangible.
Why unemployment falls anyway (and it’s not good news)
Here comes the paradox that short-circuits anyone reading only the headline. The unemployment rate dropped to 4.2%. Good, right? No.
It fell for the wrong reason. The labor force participation rate slipped 0.3 percentage points, to 61.5%: the lowest since March 2021. In plain terms, unemployment didn’t fall because more people found work, but because more people stopped looking. When you leave the labor force, statistically you’re not “unemployed.” The number improves while reality worsens. Classic.
The reaction: dollar down, gold up, oil at lows
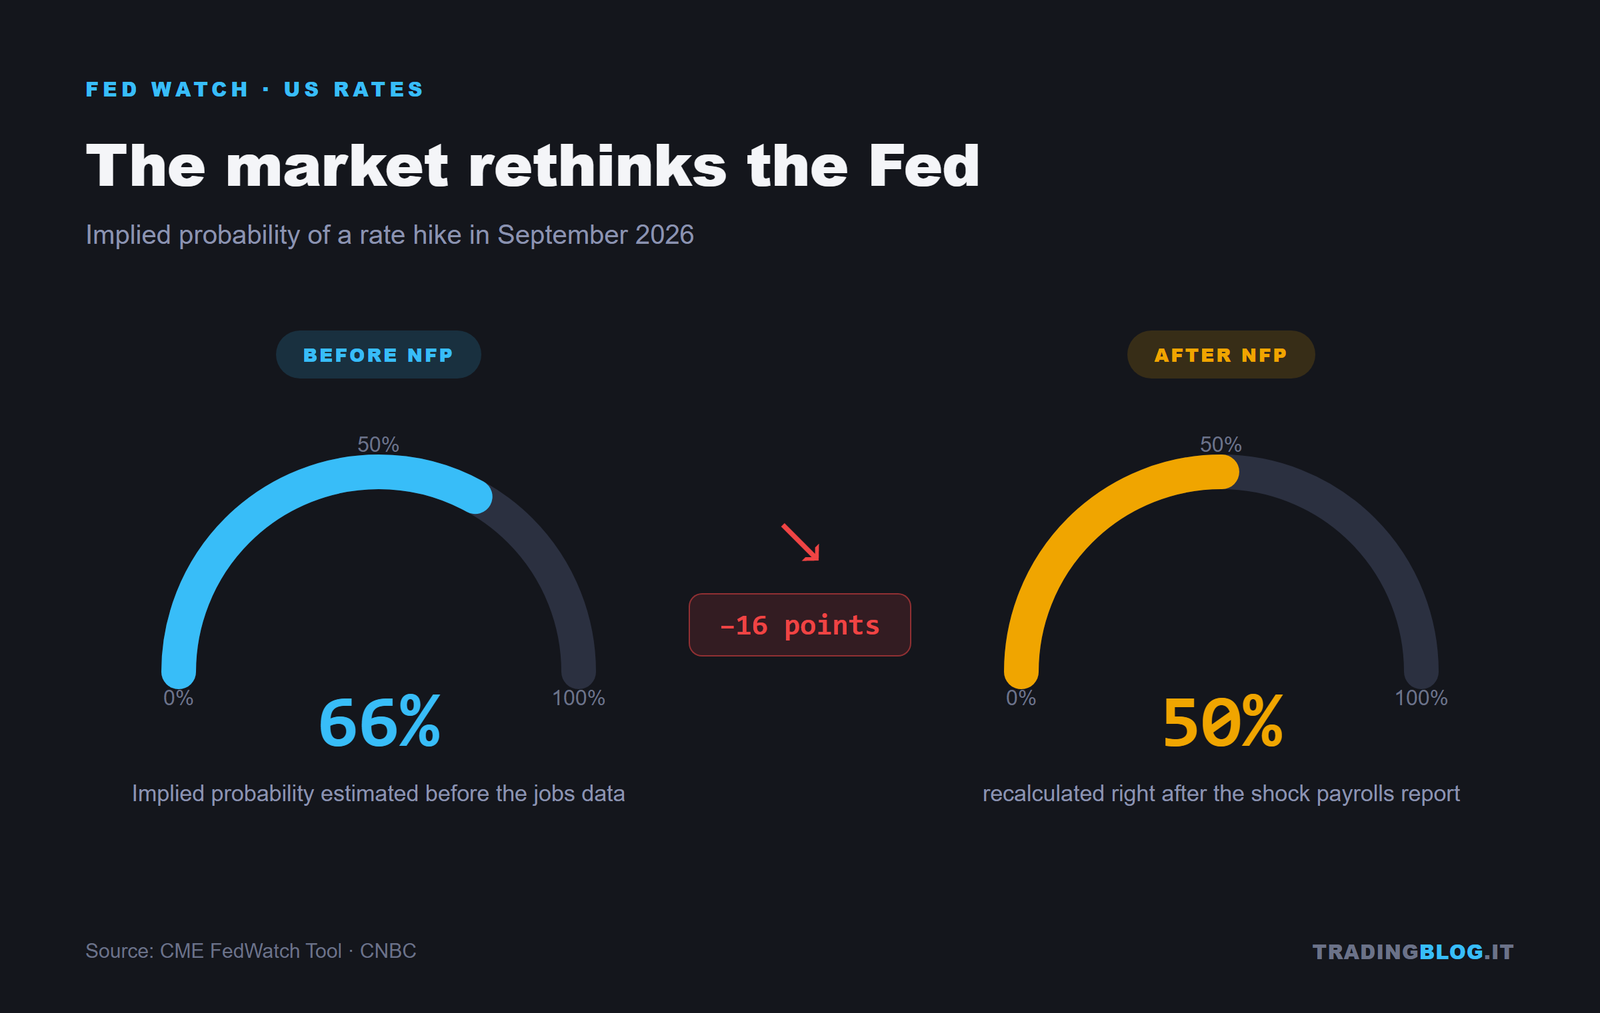
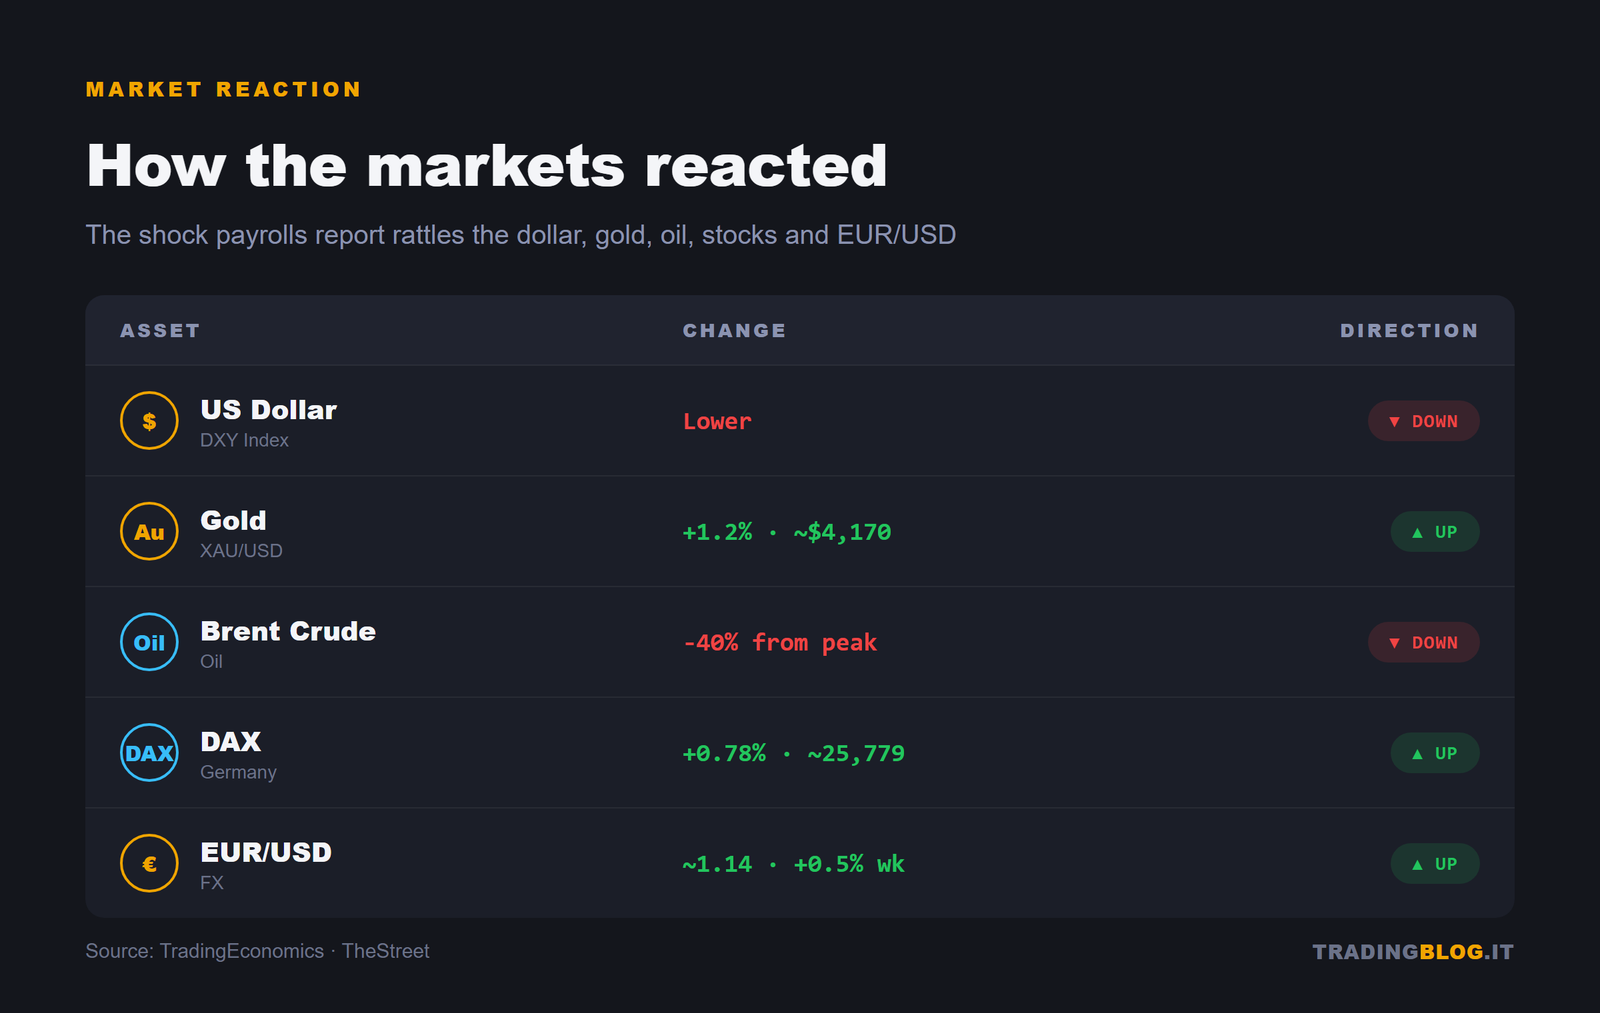
The market reacted by the book to a weak print. The dollar gave up ground, because a slowing economy reduces the Fed’s urgency to tighten further. The implied odds of a September hike slid from about 66% to 50%: from near-certainty to a pure 50/50.
With a softer dollar, gold started running again. The yellow metal rose to about $4,170 an ounce on July 3, up 1.2% in the wake of the weak NFP. It stays well below the 2026 record, that ~$5,597 hit on January 29, but the message is clear: when real rates stop rising, gold breathes.
Oil, on the other hand, plays a game all its own. Brent ended up below $71 (August at ~$70.82), WTI at ~$69.58 on July 2: lows since the confrontation with Iran began. Brent has shed over 40% from its peak above $126 on April 30. The reason isn’t U.S. macro, but progress in the Qatar-mediated U.S.-Iran talks: less geopolitical risk, less premium on the barrel. Crude at these levels is disinflationary, and indirectly helps doves everywhere.

EUR/USD and the ECB: the European side
The euro took advantage, pushing EUR/USD toward 1.14. But be careful not to read it as pure euro strength: it’s mostly dollar weakness.
On the European front, in fact, inflation slowed. June HICP fell to 2.8% from 3.2%, with core at 2.4%, both below expectations. Lagarde adopted a dovish tone, and this deflated expectations of a second ECB hike after the June 11 surprise, when the deposit rate had risen to 2.25%. EUR/USD closed just above 1.1429, up 0.5% on the week.
The picture is therefore symmetrical and curious: two central banks easing off the tightening just as equity markets party.
Stocks at records: the party continues
Because yes, the exchanges are celebrating. The Dow Jones set a new record on July 2. On the week the S&P 500 posted +1.8%, the Nasdaq +2.1%, the Dow +2%. In Europe the DAX was trading around 25,779 points on July 3, up 0.78%. U.S. markets were closed on July 3 for the early July 4 holiday, so the baton passed to Europe.
The rally’s logic is the same as always in this 2026: a weak print means a less aggressive Fed, less aggression means less tight financial conditions, and that’s enough for risk-on. Stocks rise when they should fall. It’s the paradox that’s held the floor for months.
So why does the Fed stay hawkish?
Because one month’s snapshot doesn’t flip a stance. At the June 17 meeting the Fed held at 3.50-3.75%, but raised the median 2026 dot to 3.8% from 3.4%, with nine members seeing at least one more hike. The underlying bias stays restrictive. A weak NFP dents the narrative, it doesn’t demolish it: it’ll take confirmations, not a single print pushed low by people who stopped looking for work.
What to watch
The week ahead is dense. The bulk arrives Wednesday July 8 with the FOMC minutes: we’ll look at how compact that “nine hawkish members” was, because an internal split would change the price. Also on the 8th there’s the RBNZ, useful for sentiment on the New Zealand dollar and on risk appetite. Thursday July 9 the weekly jobless claims will tell whether the U.S. labor slowdown is a fluke or a trend.
Levels to monitor, no forecasts:
- EUR/USD: 1.14 is the psychological watershed; below 1.1429 the weekly picture weakens, the 1.15 territory is the resistance to break.
- Gold: the 4,170 area as a recent base; above it, interest toward the highs reignites, below it, we fall back into the prior range.
- DAX: 25,779 as the July 3 reference; holding above 25,700-25,800 to confirm momentum, otherwise the supports below get tested.
One data point doesn’t make a trend, but it changes the odds. And in a market where the Fed says one thing and prices do another, knowing how to read the intermarket chain is worth more than any blunt forecast.
Content for purely informational and educational purposes. It does not constitute financial advice or an investment solicitation.