It was not a move. It was the start of a cycle.

Hi trader,
on 16 September the Fed raised rates for the first time in more than three years.
In the six days that followed the Nasdaq printed two record highs in a row and the VIX fell 20%.
If your reaction is “the market did not get it”, stop for a second. Because the numbers say the opposite: the market got it perfectly well, and what it got is more interesting than the hike.
Ok, vamos.
What happened, in three lines
Twenty-five basis points, from 3.50-3.75% to 3.75-4.00%. Vote unanimous, twelve to zero, no dissent. First hike after more than three years of standing still or cutting.
You read all of that everywhere on 16 September, and a week later it is worth nothing.
What is worth something sits in the projections the committee publishes alongside the decision.
The real headline is not 2026. It is 2027.
Alongside the decision, the committee publishes its own rate projections. Eighteen dots on a chart, which become seventeen on the years further out, because one participant did not submit projections for 2028 and 2029.
2026 is the part that ended up in the headlines: at least one more hike by year end, say sixteen dots out of eighteen.
But look at what happened to the years after that, comparing the September projections with the June ones.
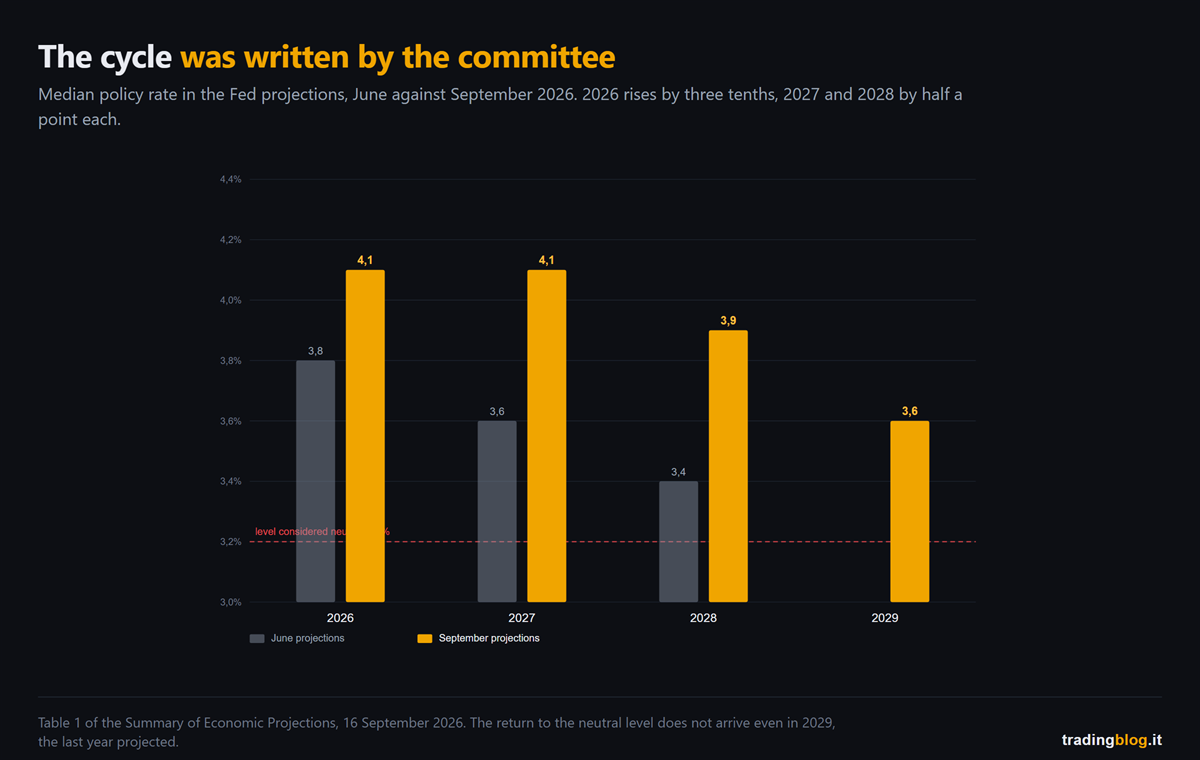
The median for 2027 went from 3.6% to 4.1%. Half a point in three months.
The one for 2028 from 3.4% to 3.9%. Another half point.
And the trip back to the level they themselves consider neutral, 3.2%, never arrives at all. Not even in 2029, which is the last year projected: there the median does come down, but only to 3.6%.
Read it the way a trader would read it and not a journalist. The committee did not write “we hike once and then we see”. It wrote that rates go to 4.1% and stay there for two years, that in 2028 they come down to just 3.9%, and that at the end of the forecast horizon they have still not gone back to the level considered neutral.
That is not an isolated move. It is a high level held for years, written by the people who have to hold it. And in a moment you will see that the market expects even more than that.
And the market? It said they were right.
Here comes the part that flips your instinct.
When a central bank starts hiking, the script everyone expects is: equities down, volatility up, credit spreads widening, yields up all along the curve.
Between 16 and 22 September none of that happened. The numbers in this section sit inside that window, with two exceptions I flag as they come: the yield curve, which stops on the 21st, and the last data point, which measures the reaction of a single day.
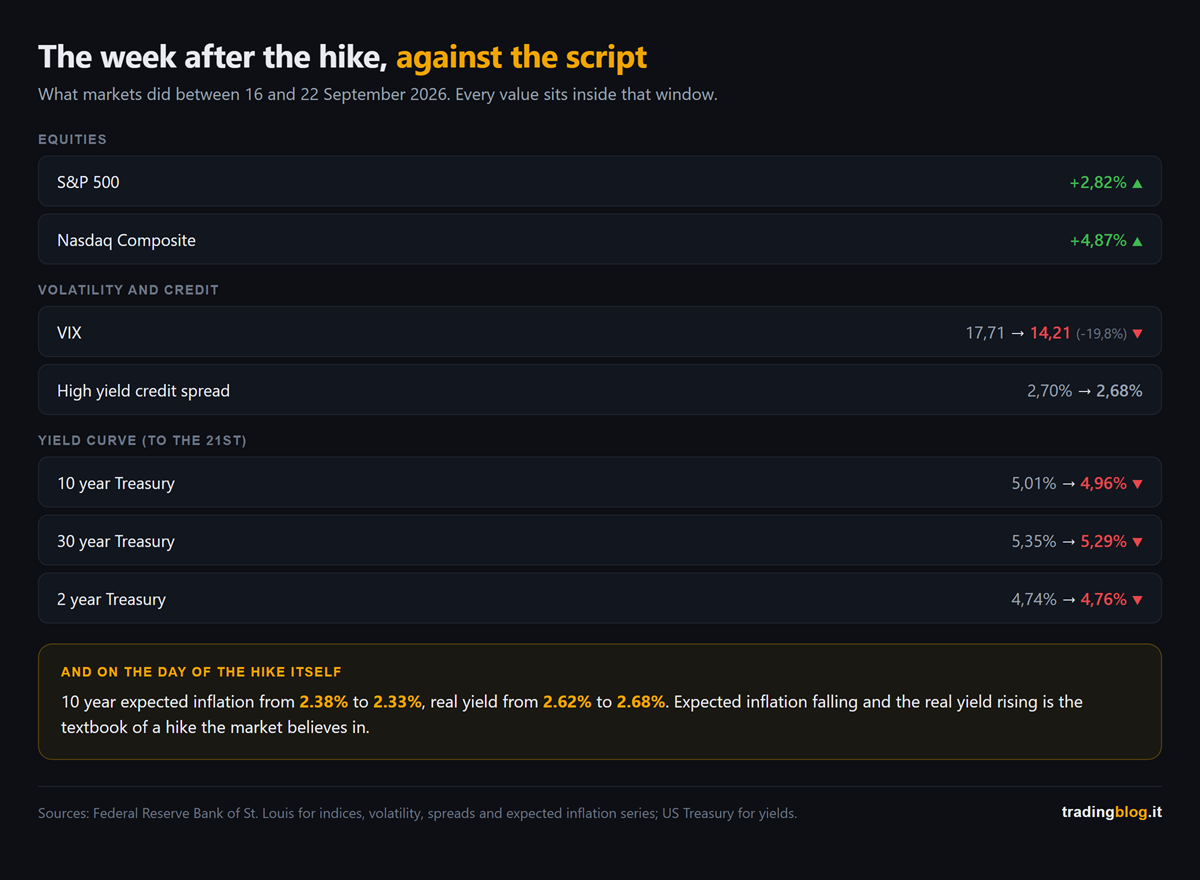
The S&P 500 did +2.82% and the Nasdaq +4.87%, with a record high on the 21st and another on the 22nd.
The VIX went from 17.71 to 14.21, so minus 20%, at the lows of the month. Anyone selling volatility on the day of the first hike in three years was right.
High yield credit spreads did not widen by a single point: 2.70% on the day of the hike, 2.68% on the 22nd. A credit market that fears a squeeze does not sit that still.
And now look at the yield curve, where the data stops on the 21st because that is the last day published.
The two year went up, from 4.74% to 4.76%. The ten year went down, from 5.01% to 4.96%, and the thirty year from 5.35% to 5.29%.
Short end up, long end down: the curve flattened by seven basis points. And it is the same thing the earlier numbers say, put another way: the market expects more tightening now and less inflation later.
But the number that explains everything is another one, and it is the subtlest. This is the only one that falls outside the window, because it measures the reaction of a single day: it compares the close on the 15th with the close on the 16th.
On the day of the hike ten year breakeven inflation fell, from 2.38% to 2.33%, while the real yield rose from 2.62% to 2.68%.
And now the honest part, the one they usually do not tell you.
Ten year breakeven inflation is very sensitive to oil, and crude started falling exactly around those days. So a slice of that drop may be the barrel, not the Fed. Anyone selling you only the first half of the number is selling you a thesis, not a measurement.
But oil does not explain the other half. Crude falling pushes breakeven inflation down, it does not push the real yield up. Those six basis points of extra real yield on the very day of the decision are the one thing the barrel cannot account for, and that is where the thesis holds up.
Breakeven inflation down and real yield up, together, is what happens when the market believes the central bank will do its job. It is the textbook of the hike that works, not of the one that scares.
The market did not ignore the Fed. It believed it.
Where the market does not agree
There is one point where market and committee see it differently, and it is not the one you think.
On the next meeting, 27 and 28 October, futures gave 54% odds to another hike as of 22 September. A coin flip.
But looking out to December, the probability of being at least twenty-five basis points higher is 90%.
On direction they agree. The disagreement is on the when, and on the how much.
Over the next nine meetings fed funds futures were pricing, as of 22 September, around eighty basis points of total tightening, so roughly three hikes. The dot plot median forecasts one.
The market is pricing a longer cycle than the one the committee put on the dots.
And the two things I have just written do not contradict each other, they hold together: the market expects more hikes than the committee forecasts, and that is exactly why it expects less inflation.
What changes for anyone trading inside the day
This is the part that really concerns you, and it has nothing to do with forecasts.
The Fed chair, in the press conference, said two things that put together change the job.
The first: “I’m not in the forward guidance business”.
The second, explaining how he looks at the data: “data point dependence is a dangerous preoccupation”. Trends count, he said, single numbers are noise.
And he does not put his own dot on the dot plot, as he already did in June.
Translated into practice: the guidance the market had used for ten years to price meetings has been switched off by the people who issued it.
The market will keep pricing every single data point though, because that is what the market does. So the reactions to macro numbers are still there, and my expectation is that they get wider: with a central bank that refuses to guide, nobody confirms them or denies them the day after.
For anyone trading inside the day that is a concrete asymmetry: the move on the number is there, the confirmation that used to come afterwards is gone. You trade the reaction, not the anticipation, and to do that you need to know when the number lands.
The dates that really count
They are not all the same, and two of them weigh more than all the others put together.
Friday 2 October, the September jobs report. The committee projects unemployment flat at 4.1% for the next four years, so it expects no cost on the labour side. A weak jobs number is the thing most likely of all to change the committee’s mind from the inside. With one honest caveat: the standard the chair has set himself is declaredly about inflation, not about employment.
Wednesday 14 October, September inflation. It is the last consumer price print before the meeting on the 28th, and the chair said in the press conference that he builds his own estimates precisely on that one and on producer prices. It is the number that decides whether the next hike is in October or in December, and on that day the coin flip I mentioned above resolves one way or the other. The day after, on the 15th, producer prices come out, the second of the two numbers the chair builds his estimate with.
And be careful not to get confused: that number does not decide the committee’s mind, it decides the price. The chair has just said that he does not look at single numbers. The market does, and that is where the odds move.
Before those, on Wednesday 30 September, the August PCE comes out. It serves to check an estimate the chair made out loud in the press conference, and if it comes in above, the squeeze gets firmer.
And one to write down: the 28 October meeting has no dot plot. Statement and press conference only. The next update to the dots is in December.
A note on what can go wrong
The chair gave three reasons for the hike: an economy stronger than expected, inflation not coming down enough, and geopolitics.
The third has already moved, but not in the simple way. Crude had spiked all the way to 107 dollars on 15 September, the day before the decision, and from there it came back toward ninety, pushed by the diplomatic openings on Iran and by the expectation that Saudi Arabia will restart a major pipeline.
Watch out though: that is the unwinding of a spike, not a collapse. The barrel is still above late August levels. If it falls further, part of the job gets done by oil from the outside without the committee having to change its mind. If it climbs back up, it puts back in play one of the very reasons they hiked.
A note, because the week has already turned
What you have read above is the week from the 16th to the 22nd. On the 23rd the wind changed: equities came off the highs and the ten year yield went back up toward 5%, precisely on the fear of more hikes.
It does not disprove anything. If anything it confirms the more uncomfortable part: the market is not pricing less tightening, it is pricing more.
The circle we close
On 11 September, on this blog, we wrote that the number that decides the Fed is not the headline one but the core, and we argued it with the projections the ECB published the day before, where from 2027 onward core stays above the headline.
Five days later the Fed hiked, and its projections say exactly the same thing from the other side of the Atlantic: headline inflation coming back down first, core lagging behind, and rates that as a result stay high for longer.
Two central banks, same diagnosis. If you missed that piece, Friday’s CPI: the number that decides the Fed is not the headline is where this conversation started.
Breakeven inflation falling and the real yield rising is not a market ignoring the central bank. It is a market that believes it.
Let me close with the thing I wrote down in my notebook that evening.
For ten years we traded inside a system where, after every data release, somebody turned up to tell you how to read it.
That somebody has just said he will not be doing it any more.
It is not good news and it is not bad news. It is simply that noise now stays noise for longer, and the job goes back to being reading the reaction instead of waiting for the explanation.
Suerte Amigo!
Tiziano Brunno
Tradingblog
Want to put your market reading to the test?
Compete and challenge other traders inside an Arena in a demo environment, with no real capital at risk. Discover the Performance Arena Events by The Thunder Trader.
Disclaimer: purely informational and educational content. It does not constitute financial advice or an invitation to trade. Trading involves the risk of capital loss.