The COT report, how to actually read it

Hi trader,
the first time I opened a COT report on the S&P I nearly had a heart attack.
Hedge funds were short. Heavily short, hundreds of thousands of contracts.
In my head the movie was already written: the big guys know something, they’re about to crash everything, and there I am, long like a sitting duck.
Nothing crashed.
And the week after, they were still short. And the week after that too.
Then I went and looked at the history, and found out the thing nobody had told me: on the S&P future, leveraged funds are short almost all the time. From January 2016 to the report of 29 September 2026, out of 561 weekly reports, they were net long 15 times. The last one on 8 March 2022.
That day I realized I hadn’t read the COT. I’d just looked at it.
In the piece on the four questions before opening the chart I gave you the short version. And in the crypto lesson on what moves the price I told you that funding is NOT the COT. Today I’ll explain what the COT is, and above all how to read it without getting hurt.
Ok, vamos.
What it is, in four lines
The Commitments of Traders is published by the CFTC, the agency that oversees US futures.
The positions of the big players, the ones above certain thresholds, are reported to the CFTC every day. Once a week the CFTC publishes the aggregate snapshot, split by categories.
The snapshot is taken at Tuesday’s close. It’s published on Friday at 15:30 New York time, which for us in Europe means the evening. Holidays aside, which shift the calendar.
And it only exists for markets where at least 20 traders sit above those thresholds. On ES that’s not a problem.
Which report: the detail that changes everything
This is where the first fool trips up, and I was the fool.
There’s more than one report.
The Legacy is the oldest, and it splits the world in two: commercial, meaning those who use futures to hedge a risk from their own business, and non commercial, meaning everyone else. It’s the one you see quoted everywhere.
The Disaggregated is built for commodities: it separates producers and processors, swap dealers, funds and the rest. On oil, wheat and gold it makes sense.
The Traders in Financial Futures, TFF to its friends, is built for financial futures: stock indices, currencies, rates. If you trade ES or NQ, this is the one you need to look at.
And careful, because the CFTC says so itself: the TFF is not a more detailed version of the Legacy. Its categories can draw from both the commercial and the non commercial side. So “commercial = the people who deal in the goods”, which works on oil and wheat, gets you nowhere on the S&P. Nobody manufactures the S&P 500 in a warehouse.
I know, in the four questions piece I talked to you about commercials and speculators. On oil and wheat that still holds. On indices, today I’m taking you one step further.
The four families of the TFF
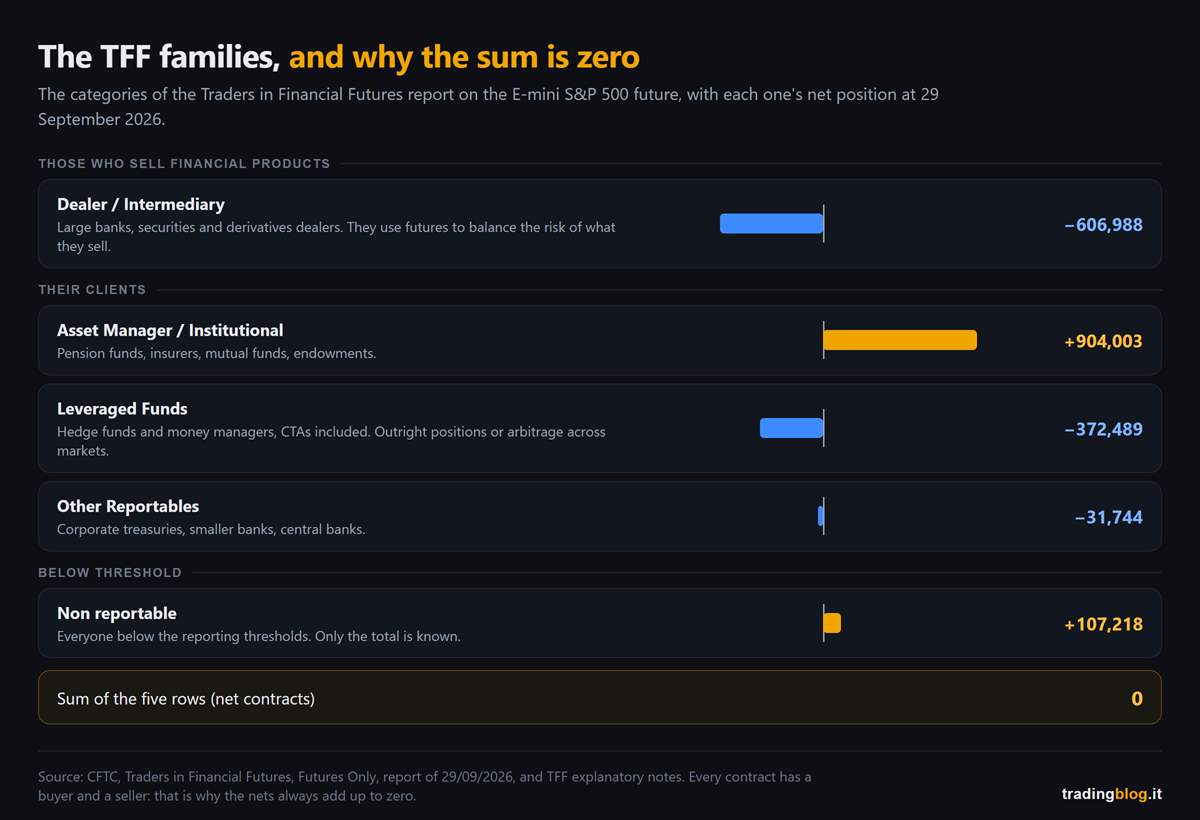
Let me explain it properly, with the CFTC definitions translated into human.
Dealer/Intermediary. The sell side: big banks and dealers in securities and derivatives. They build products for clients and use futures to balance the risk of what they’ve sold. Usually they’re not betting, they’re hedging the house.
Asset Manager/Institutional. Pension funds, insurers, mutual funds, endowments. Slow, big money.
Leveraged Funds. Hedge funds and various money managers, CTAs included. The CFTC writes that their strategies can be outright positions or arbitrage between different markets. Keep that in mind, you’ll need it in two minutes.
Other Reportables. The ones above the threshold who don’t fit the other three: corporate treasuries, smaller banks, central banks.
Plus a fifth row: the non reportables, meaning everyone below the threshold. The small fry. The CFTC only knows their total, not who they are.
Two words you need to have clear
Net position. Long contracts minus short contracts, by category. If asset managers have one million one hundred thousand longs and two hundred thousand shorts, they’re net long around nine hundred thousand.
Open interest. The CFTC defines it as the total of contracts open and not yet closed. Every contract has a buyer and a seller, which is why the net positions of all the categories, added up, come to zero. Always. If someone is net long, someone else is net short by the same amount.
Look at what ES open interest does around an expiry. On 8 September 2026 it was 2,071,836 contracts. On 15 September, three days before the quarterly expiry on the 18th, it was 2,446,519. On 22 September, after expiry, 1,890,653.
That’s not a wave of new money followed by a stampede out. It’s the rollover: for a few days the expiring contract and the new one live side by side, and the numbers swell.
The real example: ES over the last three years
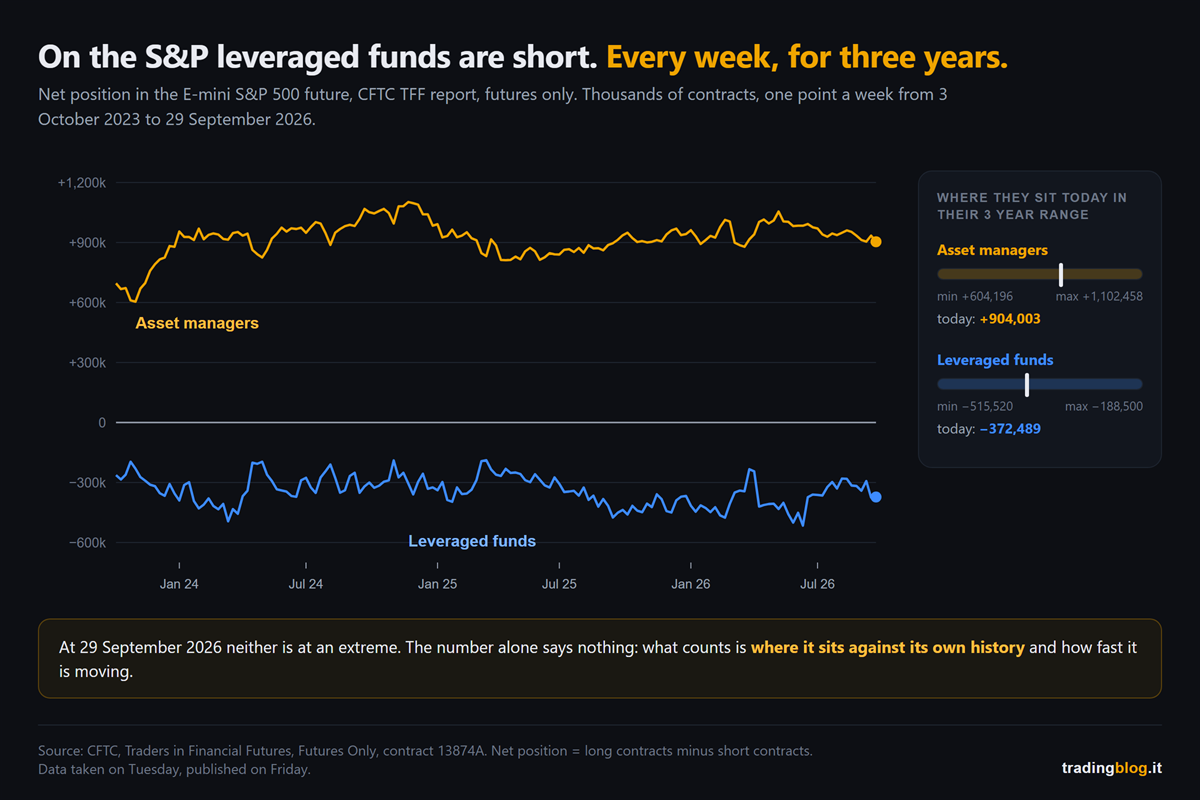
As of the report of 29 September 2026, the latest available as I write:
asset managers are net long 904,003 contracts;
leveraged funds are net short 372,489 contracts.
Read like that, the second number is scary. It’s the same one that scared me.
Now put it inside its history. Over the last three years the leveraged funds’ net position has gone from a low of -515,520 (16 June 2026) to a high of -188,500 (18 March 2025). It has never been positive. Today it sits a bit below the middle of its range.
And look at the dates. The low and the high both fall in the week of a quarterly expiry. Exactly the weeks I’m about to tell you to be wary of.
Asset managers, over the same period, went from 604,196 (31 October 2023) to 1,102,458 (26 November 2024). Today they’re a good way past the halfway mark.
Translated: this week the COT on ES isn’t telling you anything special. No extremes, no rush.
And you know what? I ran the numbers from 2016. In roughly three weeks out of four, neither asset managers nor leveraged funds sit at the edges of their three-year range. Most weeks the COT has nothing to tell you, and that’s fine.
The four classic mistakes
One: using it for intraday timing. It’s a weekly snapshot of aggregate positions. Inside it are players who think in months. Asking it where ES is going at 15:45 on Thursday is like asking the seasonal weather outlook whether you’ll need an umbrella at five.
Two: forgetting the delay. Snapshot from Tuesday evening, published Friday evening. If you read it on Monday morning, the data is almost six days old. In six days a leveraged fund can have flipped everything twice.
Three: mixing up who hedges and who bets. This is the one that got me at the start. The CFTC says it in black and white: it classifies traders, not individual trades. It knows a hedge fund belongs in leveraged funds, but it can’t know whether everything it does is speculation. A fund short the future can be long the stocks and pocket the difference between the two prices. Direction may mean nothing to it. That’s why “funds are short” on the S&P doesn’t necessarily mean “funds are betting on a drop”.
Four: looking at the level instead of the extremes and the changes. Minus 372,000 contracts, on its own, means nothing. It only becomes information when you compare it with that category’s history: is it near the edge of its range? Has it been moving fast in one direction for weeks? And even then, watch out for rollover weeks, where the numbers jump around for reasons that have nothing to do with positioning.
How I use it
I told you in the four questions piece and I’ll say it again: for me the COT is context, never a signal.
It tells me what room I’ve walked into. If a category is crammed at one extreme of its history, I expect that on the day it decides to leave, the door will be narrow. I don’t know when, and the COT will never tell me.
It doesn’t get me in. It doesn’t get me out. It just makes me more careful with my trade management.
And here’s a practical thing. The calculation I did above, meaning where a position sits today within its range, is mind-numbingly boring to redo by hand every Friday. In Thunder Desk you’ll find it already done, in an index from 0 to 100 over the last three years, free, you just need to sign up. Just know that there the calculation is done on the Legacy speculators, the non commercials, and as a proportion of open interest. So on ES and NQ it’s a rougher thermometer than the TFF I’ve walked you through today, and the numbers won’t match the ones above. For a first look it’s fine. To understand who’s behind it, open the TFF.
What you do starting tomorrow morning
On ES and NQ open the TFF, not the Legacy. They’re two different reports, and the categories don’t translate from one to the other.
Before reading a number, look at its history. A net position only makes sense within its range.
Note the date of the snapshot, not the date you read it. Tuesday, always.
In quarterly expiry weeks, take everything with a pinch of salt.
The COT doesn’t tell you when to get in. It tells you what room you’ve walked into, and how narrow the door is.
Back to that first time.
Funds were short, and I had seen a signal.
They were short the way they almost always are, and the signal was only in my head.
The COT is an honest tool: it tells you exactly what’s written in it, no more, no less. The problem is us, reading into it what we want to find.
Suerte Amigo!
Tiziano Brunno
Tradingblog
Want to put your market reading to the test?
Compete and challenge other traders inside an Arena in a demo environment, with no real capital at risk. Discover the Performance Arena Events by The Thunder Trader.
Disclaimer: purely informational and educational content. It does not constitute financial advice or an invitation to trade. Trading involves the risk of capital loss.