Posts

Rising US dollar index with Fed, ECB and BoJ rates compared

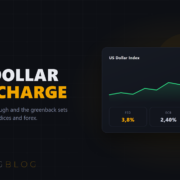
The strong dollar and what it really does to your trades

Hey trader,

let me ask you a blunt question. When you take a trade, on gold, on the DAX, on EUR/USD, do you actually look at the dollar? If the answer is “every now and then”, relax, we’ve both been burned at least once.

The dollar is the remote control of the markets. You press it and it changes the channel on everything: commodities, indices, forex, gold. And right now that remote is in the hands of a man who has decided to talk tough.

The Fed shifted gears

The Federal Reserve is led by Kevin Warsh, and the message came through loud and clear: inflation is still too high. So much so that they raised their own inflation projection for 2026, the PCE, from 2.7% to 3.6%. That’s not a detail for economists, it’s a change of course.

Until recently the market was betting on cuts. Now it’s even pricing in fresh hikes, with the key meeting on the calendar for July 29. From “when do they cut” to “how many times do they hike”. You get the vibe.

Why the dollar is running

Here’s the interesting part, and it’s why the dollar is running. Careful though, it’s easy to get this one wrong. It’s not that the other central banks are cutting: inflation has spooked pretty much everyone. The ECB raised rates in June and the market is betting on another move in September, and even the Bank of Japan, historically the slowest of them all on rates, is hiking too. The whole world is stepping on the inflation brake.

The real point is a different one: within that group, the Fed is the one pressing hardest. And there’s a second engine. When tensions flare up, like now in the Middle East, money runs for cover, and the classic shelter is still the dollar. The most aggressive Fed, combined with the flight to safety: that’s the fuel driving the greenback.

And your trades, what does it do to them?

Now the practical part, because theory without application is hot air. A strong dollar, as a rule, weighs on three things you probably have on your book:

  • Gold, priced in dollars: dollar up, gold under pressure.
  • EUR/USD and the other pairs against the dollar: if the greenback is strong, the euro struggles.
  • Indices and risk-on: high rates and a strong dollar take oxygen away from stocks.

I’m not telling you to short everything because “the dollar is strong”, that would be the usual barroom shortcut. I’m telling you something else: before you hit enter, take a look at what the dollar is doing. It’s the context. And context, in trading, is half the job.

What I’m watching from here to July 29

Three things, little theory and a lot of practice:

  • The Fed’s tone as the meeting approaches. Warsh’s words move the dollar before the facts do.
  • The inflation data: every upside surprise is fuel for the dollar.
  • The reaction of gold and EUR/USD, which tell me in real time whether the market believes it.

July 29 is not a day like the others. You don’t have to trade it, but you’d better know it’s there. The market isn’t going anywhere: if you don’t have a clear picture, it will still be there tomorrow.

Earnings don’t move the overall market; it’s the Federal Reserve Board. Focus on the central banks and on the movement of liquidity.

Stanley DruckenmillerPosta su X

That’s it from me. If it helped, pass it to another trader who only ever looks at the chart and never at the dollar. It costs you nothing, and it might save him a trade.

Suerte Amigo!
Tiziano Brunno Tradingblog

Want to put your market reading to the test?

Compete and challenge other traders inside an Arena in a demo environment, with no real capital at risk. Discover the Performance Arena Events by The Thunder Trader.

Discover The Thunder Trader →

Disclaimer: purely informational and educational content. It does not constitute financial advice or an invitation to trade. Trading involves the risk of capital loss.


Gold Above $4,000: What the Market Is Really Pricing In

🤓 Nerd Mode

Every time gold prints a new high, the usual chorus comes back: “it’s inflation”, “it’s fear”, “it’s war”. These are convenient explanations, and almost always wrong. With gold above 4,000 dollars an ounce, the real engine is far less emotional and far more mathematical than what they tell you.

Gold is not pricing fear. It is pricing real rates. And until you understand this, you will keep reading the yellow metal through the wrong lens.

Gold has no yield, and that is everything

A gold bar pays no coupons, distributes no dividends, earns no interest. It just sits there, being a bar. That means holding gold has an opportunity cost: the money you park in it is not earning anything elsewhere, for example in a government bond that pays interest.

And this is where the variable that really counts comes in: how much you earn, net of inflation, by holding bonds instead of gold. When that real yield falls, the cost of holding gold collapses, and gold flies. When it rises, gold struggles. It is an almost mechanical relationship.

🧩 Explained Simply: real rates

The real rate is the yield of a bond net of inflation:

Real rate = Nominal rate − Expected inflation

If a government bond yields 4% but expected inflation is 3%, your real gain is only 1%. Gold competes with that real yield: when it is high, holding gold (which yields nothing) is expensive and gold falls; when it is low or negative, gold becomes competitive and rises. Remember this inverse relationship: it is reading key number one.

The three forces at play on gold right now

Here’s the interesting part, because the current picture is not the textbook gold bull’s dream at all: right now two of the three forces are working against it.

Engine Effect on gold
High real rates (hawkish Fed) Warsh’s Fed sees inflation still too high and the market is pricing a possible September hike: high real rates mean a high opportunity cost for gold → headwind
A strong dollar The Fed, more aggressive than the other central banks, keeps the dollar supported: and a strong dollar, as a rule, weighs on gold → headwind
Central bank buying For years central banks have been accumulating gold to diversify away from the dollar: structural demand, not emotional

And here’s the lesson: gold is at record highs despite the first two headwinds, not because of them. When an asset rises while the backdrop is against it, it is telling you who is really in charge: central banks buying month after month (China is on its 20th straight month), plus the flight to safety when geopolitics heats up. It is the same pattern we saw with Bitcoin and the ETFs: when the buyers are strong, institutional hands, the price moves differently than when retail is in charge.

What gold is NOT

Gold is not a simple “fear gauge”. In moments of real panic it often gets sold along with everything else, because it is liquid and useful for raising cash. And it is not even a perfect inflation hedge: there have been years of high inflation in which gold stayed flat, precisely because real rates were positive.

The truth is more boring and more useful: gold follows real rates and the dollar. Everything else is a side dish.

How to frame it in your trading

You do not need a degree in macroeconomics to use this reading. Three habits are enough:

1. Watch the dollar and rates, not the headlines. Before taking a position on gold, ask yourself what the dollar and real yields are doing. They are the real steering wheel.

2. Do not fall in love with the trend. An asset at its highs is fascinating and dangerous at the same time. The correct size before entering counts double when you are chasing a market that has already run a lot.

Open the Forex Lot Size Calculator

3. Track your trades. Log entries, exits and your state of mind. On gold at its highs it is very easy to enter out of FOMO: the TradingBlog Diary helps you see in black and white when you are trading with your method and when with your gut.

Gold is money. Everything else is credit.

J.P. MorganPosta su X

Want to put your market reading to the test?

Compete and challenge other traders inside an Arena in a demo environment, with no real capital at risk. Discover the Performance Arena Events by The Thunder Trader.

Discover The Thunder Trader →

Falco di luce ambra sopra una citta al buio: NFP debole ma Fed falco

NFP Shock: +57K Jobs, Yet the Fed Stays Hawkish

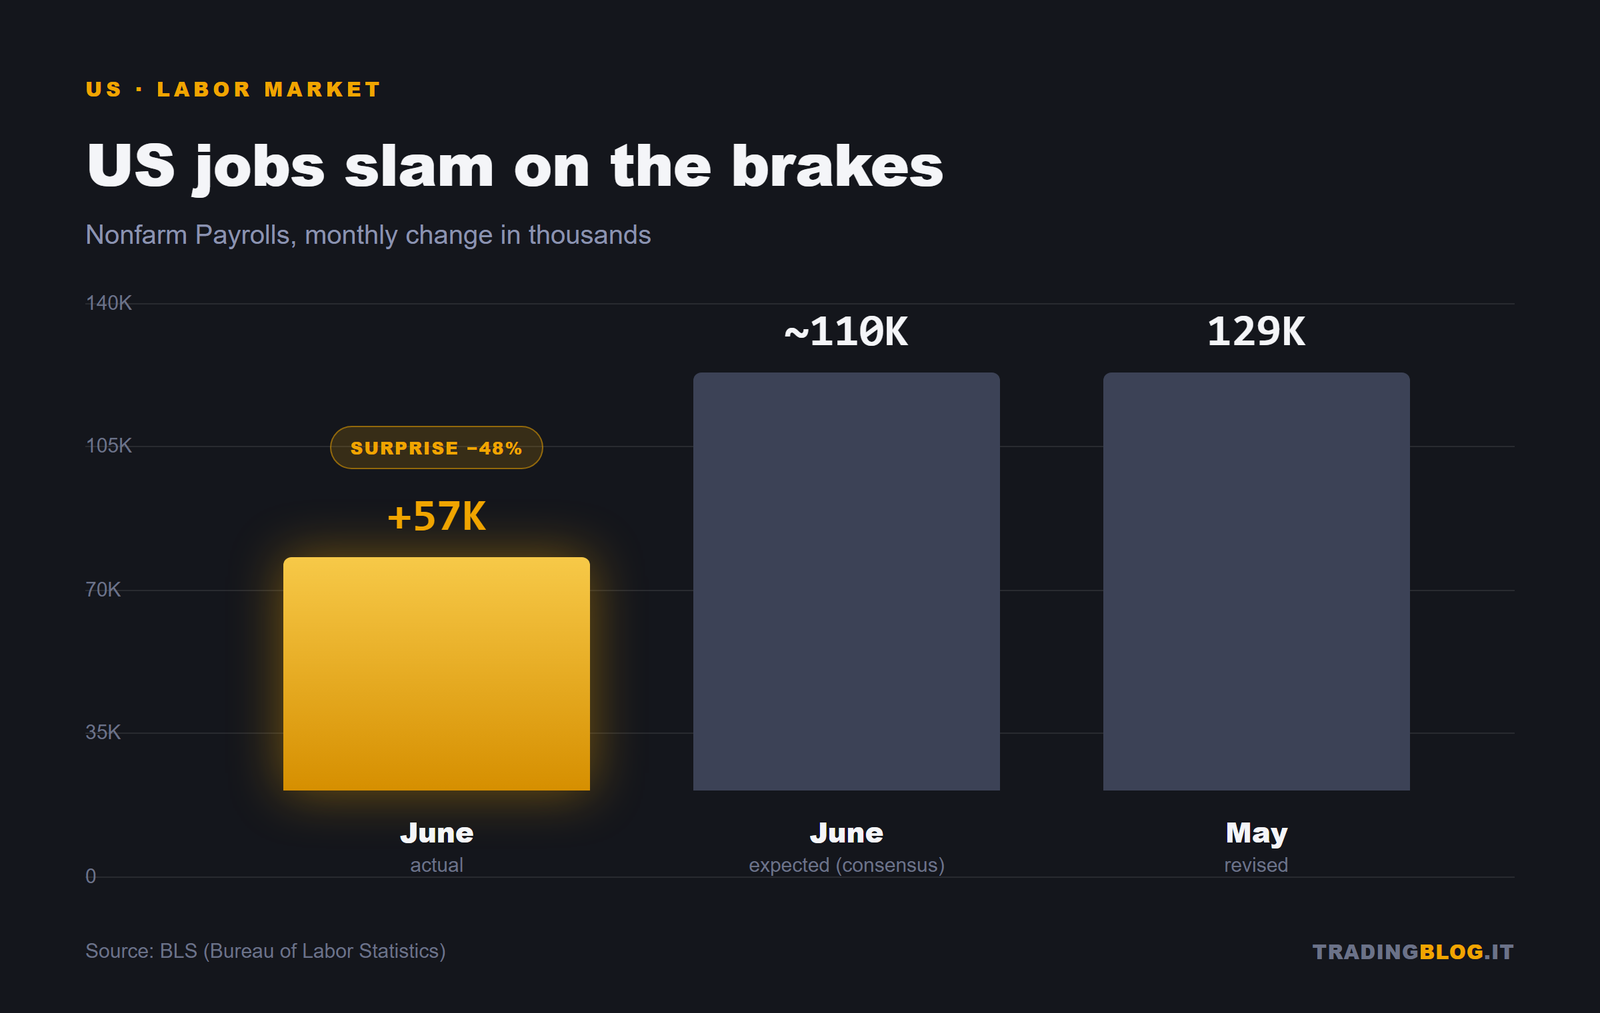
The first Friday of the month dropped its bomb, right on cue. But this time the number came in so low it looked like a typo: +57 thousand non-farm payrolls in the United States in June, against roughly 110 thousand expected. A little more than half. And if this were any old 2020, the market would already have priced in three cuts and a standing ovation for the doves.

Except this isn’t that world. We’re in the 2026 of great dissonance: the Fed is in restrictive mode, has just raised the bar on expected rates, and a weak jobs print isn’t enough to bend it. Let’s rebuild the chain, one link at a time.

The data: a labor market braking hard

Let’s start with the raw numbers. The Bureau of Labor Statistics reported +57K payrolls in June. May was revised down to 129K, and the combined April-May revision erased 74 thousand jobs we thought existed. Translated: the employment picture of recent weeks was more fragile than we thought.

Wages? Hourly earnings at +0.3% month over month and +3.5% year over year. Not a collapse, but not the wage pressure that terrifies a central bank either. The slowdown is there, and it’s tangible.

U.S. June payrolls: +57K against ~110K expected and 129K in May
June’s print came in at little more than half of expectations. Source: BLS.

Why unemployment falls anyway (and it’s not good news)

Here comes the paradox that short-circuits anyone reading only the headline. The unemployment rate dropped to 4.2%. Good, right? No.

It fell for the wrong reason. The labor force participation rate slipped 0.3 percentage points, to 61.5%: the lowest since March 2021. In plain terms, unemployment didn’t fall because more people found work, but because more people stopped looking. When you leave the labor force, statistically you’re not “unemployed.” The number improves while reality worsens. Classic.

The reaction: dollar down, gold up, oil at lows

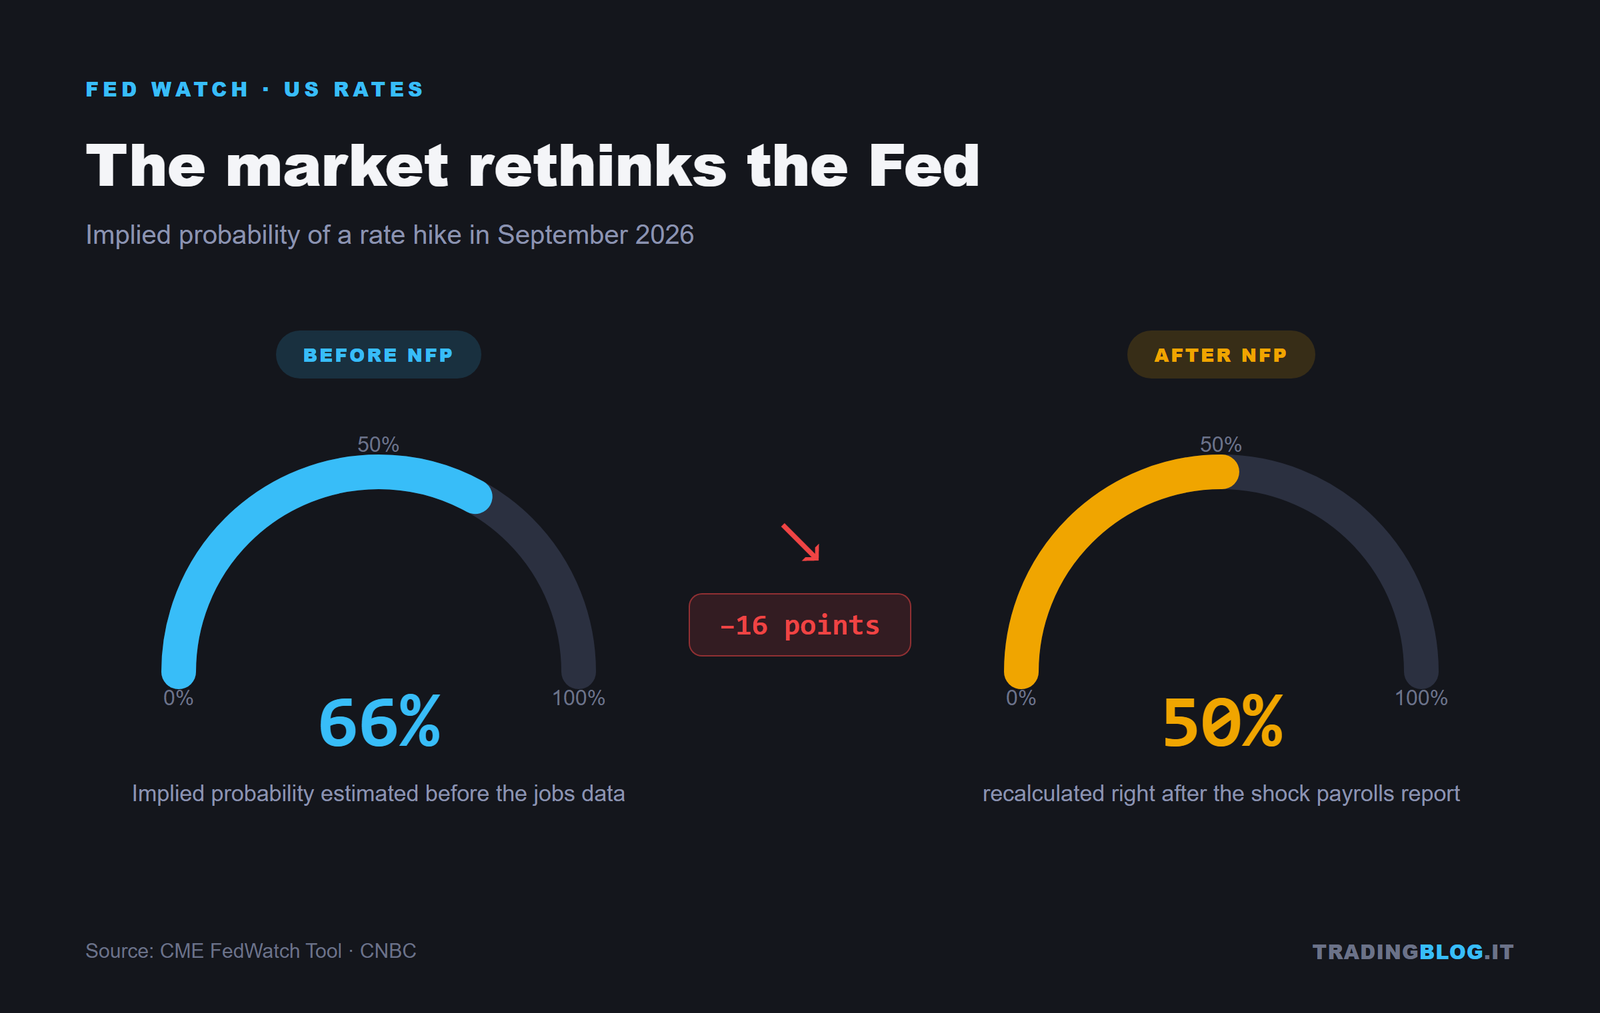
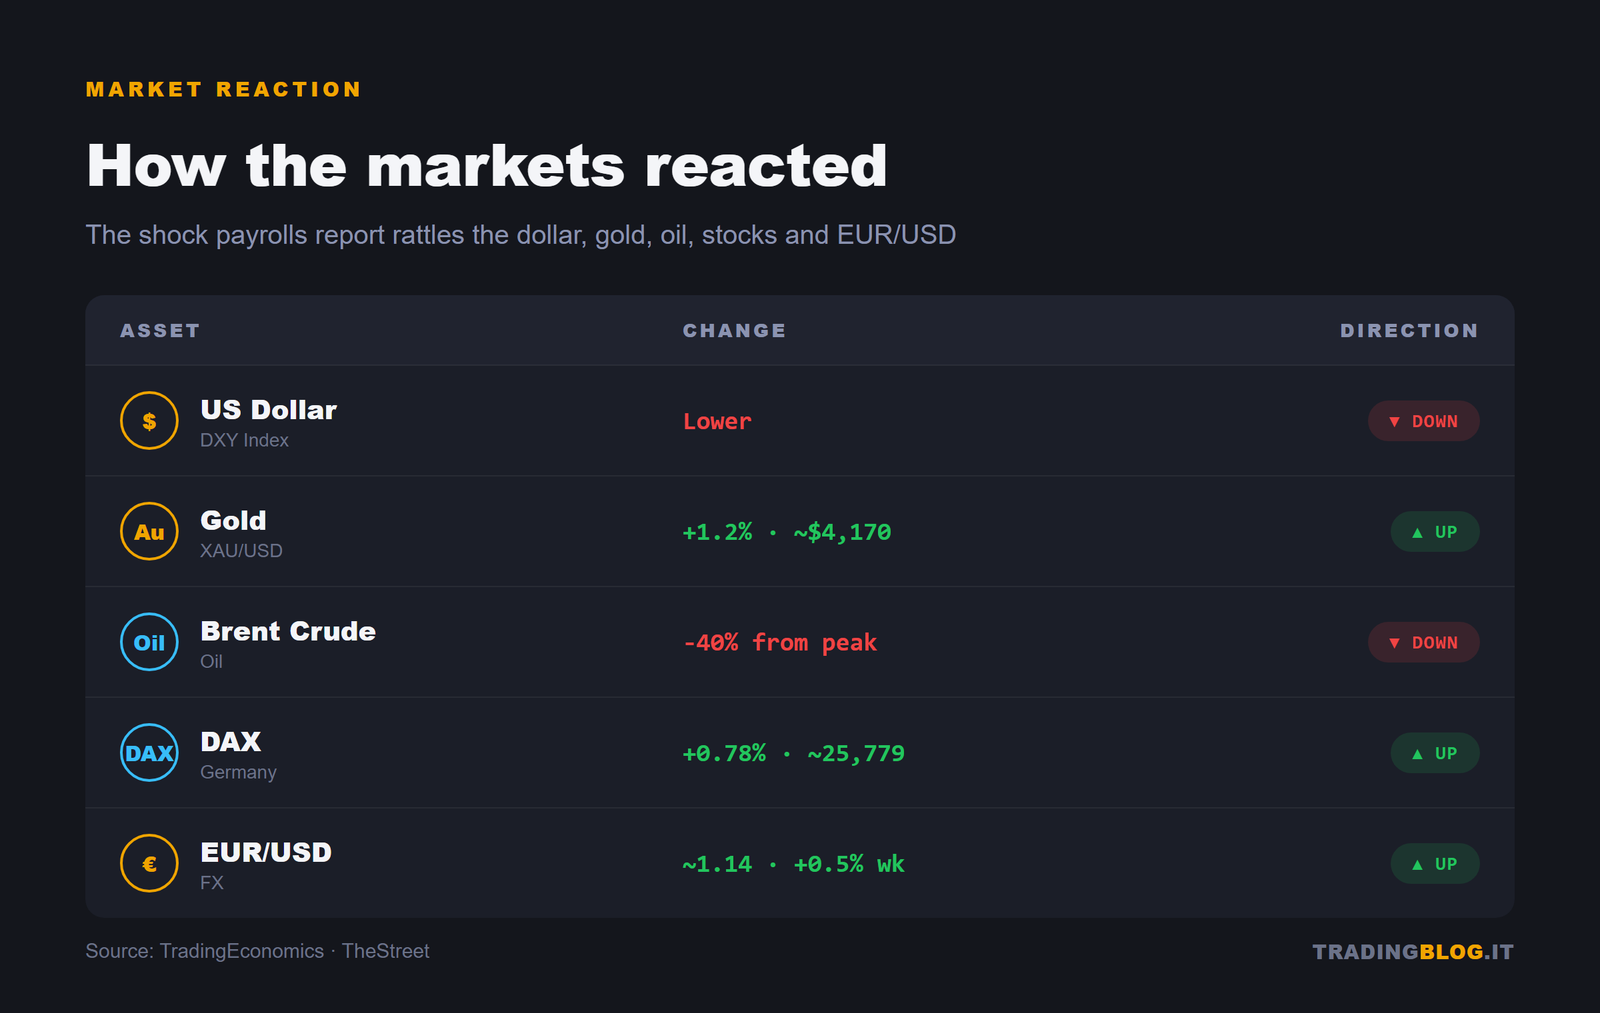
The market reacted by the book to a weak print. The dollar gave up ground, because a slowing economy reduces the Fed’s urgency to tighten further. The implied odds of a September hike slid from about 66% to 50%: from near-certainty to a pure 50/50.

Odds of a September Fed hike: from 66% before the NFP to 50% after
A single print halved confidence in a September hike. Source: CME FedWatch / CNBC.

With a softer dollar, gold started running again. The yellow metal rose to about $4,170 an ounce on July 3, up 1.2% in the wake of the weak NFP. It stays well below the 2026 record, that ~$5,597 hit on January 29, but the message is clear: when real rates stop rising, gold breathes.

Oil, on the other hand, plays a game all its own. Brent ended up below $71 (August at ~$70.82), WTI at ~$69.58 on July 2: lows since the confrontation with Iran began. Brent has shed over 40% from its peak above $126 on April 30. The reason isn’t U.S. macro, but progress in the Qatar-mediated U.S.-Iran talks: less geopolitical risk, less premium on the barrel. Crude at these levels is disinflationary, and indirectly helps doves everywhere.

Barrels and a pipeline in the desert at sunset with a falling price and a dove, symbol of de-escalation
Less geopolitical risk, less premium on the barrel: Brent slides on progress in the U.S.-Iran talks.

EUR/USD and the ECB: the European side

The euro took advantage, pushing EUR/USD toward 1.14. But be careful not to read it as pure euro strength: it’s mostly dollar weakness.

On the European front, in fact, inflation slowed. June HICP fell to 2.8% from 3.2%, with core at 2.4%, both below expectations. Lagarde adopted a dovish tone, and this deflated expectations of a second ECB hike after the June 11 surprise, when the deposit rate had risen to 2.25%. EUR/USD closed just above 1.1429, up 0.5% on the week.

The picture is therefore symmetrical and curious: two central banks easing off the tightening just as equity markets party.

Stocks at records: the party continues

Because yes, the exchanges are celebrating. The Dow Jones set a new record on July 2. On the week the S&P 500 posted +1.8%, the Nasdaq +2.1%, the Dow +2%. In Europe the DAX was trading around 25,779 points on July 3, up 0.78%. U.S. markets were closed on July 3 for the early July 4 holiday, so the baton passed to Europe.

The rally’s logic is the same as always in this 2026: a weak print means a less aggressive Fed, less aggression means less tight financial conditions, and that’s enough for risk-on. Stocks rise when they should fall. It’s the paradox that’s held the floor for months.

Intermarket reaction: dollar down, gold up, Brent down, DAX up, EUR/USD up
The intermarket chain after the NFP: dollar and oil down, gold, stocks and euro up. Source: TradingEconomics / TheStreet.

So why does the Fed stay hawkish?

Because one month’s snapshot doesn’t flip a stance. At the June 17 meeting the Fed held at 3.50-3.75%, but raised the median 2026 dot to 3.8% from 3.4%, with nine members seeing at least one more hike. The underlying bias stays restrictive. A weak NFP dents the narrative, it doesn’t demolish it: it’ll take confirmations, not a single print pushed low by people who stopped looking for work.

What to watch

The week ahead is dense. The bulk arrives Wednesday July 8 with the FOMC minutes: we’ll look at how compact that “nine hawkish members” was, because an internal split would change the price. Also on the 8th there’s the RBNZ, useful for sentiment on the New Zealand dollar and on risk appetite. Thursday July 9 the weekly jobless claims will tell whether the U.S. labor slowdown is a fluke or a trend.

Levels to monitor, no forecasts:

  • EUR/USD: 1.14 is the psychological watershed; below 1.1429 the weekly picture weakens, the 1.15 territory is the resistance to break.
  • Gold: the 4,170 area as a recent base; above it, interest toward the highs reignites, below it, we fall back into the prior range.
  • DAX: 25,779 as the July 3 reference; holding above 25,700-25,800 to confirm momentum, otherwise the supports below get tested.

One data point doesn’t make a trend, but it changes the odds. And in a market where the Fed says one thing and prices do another, knowing how to read the intermarket chain is worth more than any blunt forecast.

Want to put your market reading to the test?Compete and challenge other traders inside an Arena, in a demo environment without risking real capital. Discover The Thunder Trader’s Performance Arena Event.

Enter the Arena →

Content for purely informational and educational purposes. It does not constitute financial advice or an investment solicitation.