Poor high and poor low: the extreme that never finished the job

Hi trader,
I was shorting it with the face of someone who has understood everything.
Yesterday’s high, today’s high, same price to the tick. A textbook double top, the kind that makes people write “very strong resistance” with three exclamation marks in the Telegram groups.
Order in, stop above, off we go.
Price went through it like a knife through butter. Not even a pause out of politeness.
It took me years to understand that that high was not a resistance.
It was a job left half done.
First the name, which is already half the explanation
In the communities they call it a bad high and a bad low.
In the serious books the name is different, poor high and poor low, and it comes from Market Profile, the method Peter Steidlmayer developed at the CBOT in the Eighties to read the market as an auction instead of as a chart.
I use both names because you will hear both. But keep the second one in mind, because that is the one telling you the right thing.
Poor means poor, shabby.
Not “strong”, not “resistance”. Poor.
It is a badly made extreme, and the market usually comes back to make it properly.
Ok, vamos, let’s take it in order.
How an auction ends when it ends well
The market is an auction. It goes up until it finds someone willing to sell in size, it goes down until it finds someone willing to buy in size.
When an upside auction really ends, it does not end from tiredness.
And above all it does not end because price went “too high”. Get that idea out of your head, it does not exist: there is no such thing as a price that is too high in absolute terms, and whoever sells because “it has gone up a lot by now” finds that out the hard way, usually another two hundred points later.
It ends because price reaches the place where somebody actually wants to sell in size. There it finds serious sellers, and from there it gets rejected fast.
That speed leaves a mark, and it has a name: excess.
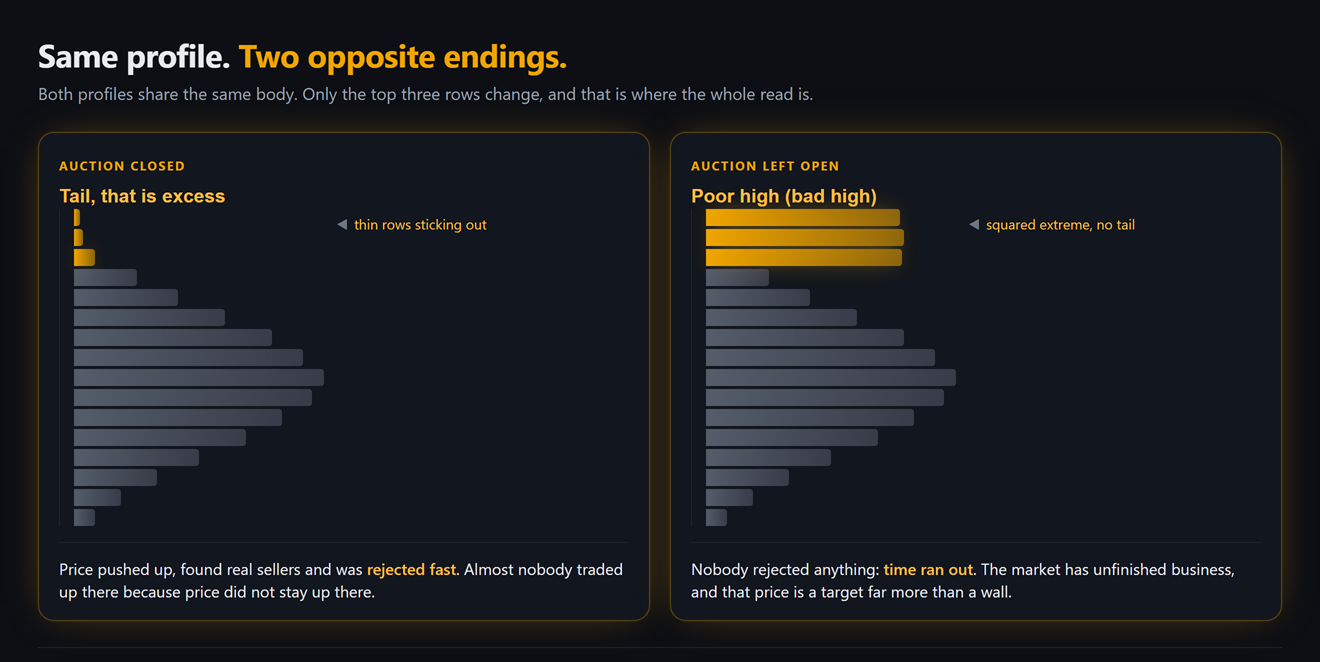
On the profile you see it as a spike sticking out: two or three very thin rows with very low volume, stuck on top of the fat body of the profile. In classic Market Profile those are the single prints of the tail, meaning prices that in the whole session only one thirty minute period traded.
The meaning is simple: almost nobody traded up there because price did not stay up there long enough to allow it.
It was pushed up, rejected, and brought back down.
That is a closed auction. The market asked the question, got the answer, turned the page.
And how an auction ends when it ends badly
Now look at the profile on the right of the picture.
No spike. No tail.
The extreme is squared off, cut clean, with two or more full rows aligned at the same price. In Market Profile terms you would say two or more TPOs ending exactly there.
That high was not rejected by anybody.
Time simply ran out.
Bell rang, shop closed, and price was still up there trading happily at the high of the day. Nobody told it no. Its session just expired.
Which is why in English it is also called unfinished business.
And unfinished business, in markets as in life, sooner or later comes knocking.
The spike that gets you, because not all spikes are the same
This is where ninety per cent of the people who have just discovered volume profile fall over, and I fell over here too.
You see a thin band, you say “excess”, you lean a trade on it.
Three cases where it is not.
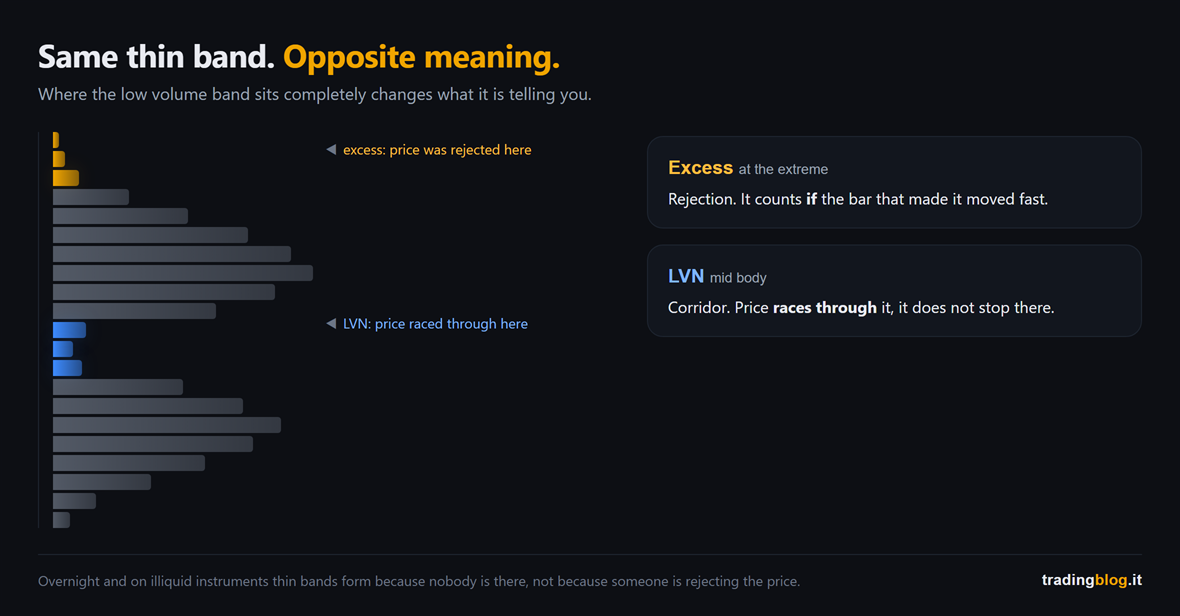
One. A spike in the middle of the profile is not an excess.
If the thin rows are in the middle, and not at the extreme, they have another name and another meaning: it is called an LVN, a low volume node.
It is not a place where somebody rejected the price. It is a place where price raced through without anyone wanting to negotiate.
It is a corridor, not a wall. And the operational consequence is the opposite: on an LVN price tends to slide fast, not to stop.
Two. An excess without speed is not an excess.
The spike counts if the bar that created it moved fast. Rejection means violence, it means price came back in a hurry.
If those thin rows formed over twenty minutes of price floating around, you did not see a rejection.
You saw stagnation with few trades, which is another thing entirely and gives you no rights.
Three. At night, spikes are worth nothing.
On futures the overnight session, and illiquid instruments in general, produce thin bands by the bucketload.
Not because somebody rejected those prices, but because nobody was there.
It is a skinny profile because the shop was empty, not because the goods were unappealing. Whoever reads those bands as rejection levels is reading the closing time and mistaking it for information.
And now the part that counts: what you do with it
Here I have to give you the uncomfortable news, the one that will probably annoy you about this piece.
A poor high is not a level to trade against.
The reasoning is straightforward, follow it.
The auction up there did not close. There was no rejection. Nobody defended that price.
So that price, far more than a wall, is a target.
A place where the market has a job to finish, where above it there are stops leaning from everyone who believed the double top, and where to get there it does not have to break any defence because the defence never existed.
That is exactly my short from the beginning: I had stood in front of a target thinking I was behind a wall.
And the operational translation is this, in two lines.
On a poor high you do not short aggressively. If you really do have a bearish idea, you do not play it there.
On a poor high, if anything, you bring a target. If you are long and above you there is a squared off high, you have one more reason not to close too early.
And above all: it is context, it is not a signal.
Nobody enters the market because they saw a squared off profile. It tells you what kind of ground you are walking on, it does not tell you to click.
The trigger stays the one you already have: how price reacts when it gets there. It gets there, slows down and reacts, or it goes straight through without even slowing down. That is the answer, and it always comes after, never before.
If you read the two order flow pieces from the last few weeks, you already have the microscope for that moment: in the bid/ask candles you see who is trading at the level, and with absorption and exhaustion you work out whether anyone is actually defending it.
The profile tells you how the auction ended at that price. Order flow tells you who is there now.
They are two different questions about the same spot on the chart, and that is why they go well together.
The percentage I am not going to give you
At this point of the conversation, live, they always ask me the same question.
“Ok Tiziano, but how often does a poor high get retested?”
And here I am going to tell you something that is not what you want to hear.
I don’t know.
I mean: there are numbers floating around, I have read them too, and I promise you that whoever fires them at you is not telling you on which instrument, in which years, on which timeframe and with which definition of “retested” they measured them.
Because the truth is that it all changes. It changes between ES and DAX, it changes between a full session and a thin August one, it changes depending on whether you count the touch to the tick or the genuine break.
A statistic you don’t know how it was built is not a number, it is an elegant way of guessing.
So the serious answer is: measure it on your market and in your hours.
You need very little. Every time you find a squared off extreme at the end of the day, you write it down. Then you write down whether price came back to it in the following days, and whether it took it out or not.
After thirty observations you have a percentage of your own, on your own instrument, and it is worth a thousand times the one from some guy on the internet. And above all you know how you counted it.
If you don’t have a place to keep these notes, use the TradingBlog Diary: it is free, it was built exactly to record observations and not just trades, and it saves you from the fate of every statistic done from memory, which is to confirm precisely what you already believed.
What you do from tomorrow morning
Small homework, as always. And for a week you do not trade it.
Turn the profile on for the session of the market you follow, and every evening look at the two extremes, the high and the low.
Then write one single word for each: tail, if the spike sticks out and it was born from a fast move, or squared, if it is cut clean.
That is all. No orders.
After two weeks open your notes and look at what happened the next day to the “squared” ones and what happened to the “tail” ones.
You need nothing else to build a view that is yours, and to stop having to take my word for it.
A high that nobody defended is not a resistance. It is a job left half done, and the market always comes back to finish its jobs.
I want to close on something that goes well beyond the profile.
For years I looked at charts hunting for walls. Levels that hold, prices that reject, textbook resistances.
The day I started asking myself “this extreme, how was it formed?” instead, half of my levels disappeared from the map.
And it was the best thing that could have happened to my account, because those levels were not holding before either.
I just didn’t know it.
If this was useful, send it to that friend of yours who shorts every double top because “it’s a double top”. You’d be doing them a favour, and you might save their day.
Suerte Amigo!
Tiziano Brunno
Tradingblog
Want to put your market reading to the test?
Compete and challenge other traders inside an Arena in a demo environment, with no real capital at risk. Discover the Performance Arena Events by The Thunder Trader.
Disclaimer: purely informational and educational content. It does not constitute financial advice or an invitation to trade. Trading involves the risk of capital loss.