The flip happened, just not where you were looking

Hi trader,
back in mid July I left you with an open question.
Is Ethereum the unlucky brother who missed the train, or a compressed spring ready to snap?
Well, part of the answer has arrived. And as usual it did not arrive where we were all looking.
The headline you read
For the first time since they exist, ETFs on ether collected more in a month than ETFs on bitcoin.
The headline has been going around for weeks, in English and in Italian, almost always with the same word: flip.
And it is true. It is not a hoax, the data is there.
The problem is that the headline stops there, and the number keeps going.
Now let’s open the number up
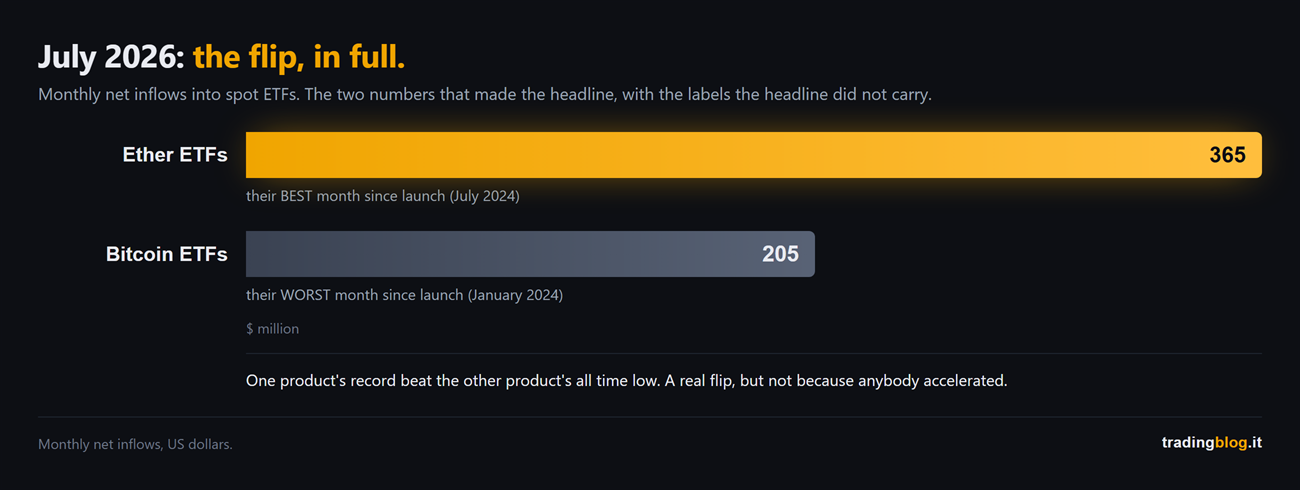
July 2026. Here are the two figures, side by side.
Ether ETFs: 365 million dollars of net inflows.
Bitcoin ETFs: 205 million.
A flip, indeed. Now look at the two labels nobody put underneath.
Those 365 million are ether’s best month since its ETFs exist, meaning since July 2024.
Those 205 million are bitcoin’s worst month since its ETFs exist.
Read that sentence again, because everything is in there.
One product’s record beat the other product’s all time low.
It is not the Ferrari that overtook the McLaren down the straight. It is the McLaren that stopped in the pits, and the Ferrari, going at its own top speed, found itself in front.
It is still an overtake. But if you bet on the driver for the wrong reason, next lap you get surprised.
And the price, what does it say?
Here comes the part I actually care about, because it is the part that touches your account.
If flows are in charge, and ether won the month on flows, ether should be flying.
Ether, in mid August, sits just above 1,900 dollars.
The 2025 peak was around 5,000.
Bitcoin meanwhile sits around 64,000, against a high of 126,080 reached in October 2025.
So the flow won and the price did not notice.
That is not a freak event, and it is exactly the same family of things we have been talking about on this blog for a month. What moves your chart often is not on your chart, and when you finally manage to see it, you find out it is smaller than they told you.
The reason is banal: proportions
Three hundred and sixty five million dollars sound like a lot because we reason with our salary in mind.
On ether’s market, which capitalises hundreds of billions, that is a tap. It is not a dam.
There are single ugly sessions where more value than that moves on ether in a few hours.
So the right question is never “how much came in?”.
It is “how much came in compared to what?”.
And here is the number nobody made a headline out of, which is by far the biggest in the whole story.
The real number, the one with no headline
In the first half of 2026 bitcoin ETFs lost 5.4 billion dollars net.
It is the first half year in the red since they exist, meaning since January 2024.
Assets under management fell from over 70 billion to roughly 55 by the end of June.
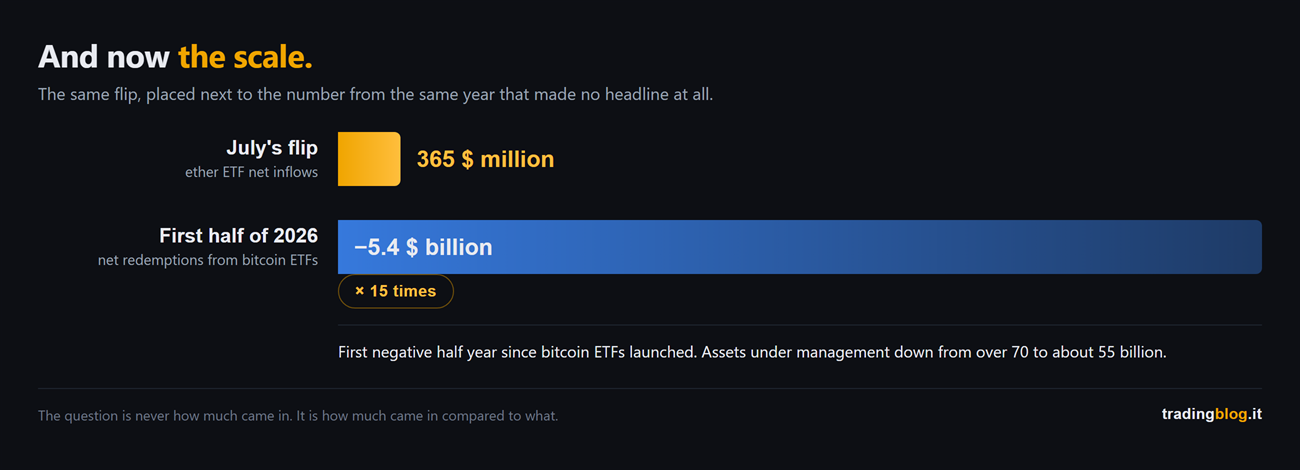
Look at the figure and hold on to that proportion, because it is worth more than ten articles.
The “flip” worth 365 million is fifteen times smaller than the river that had been flowing out of the other side in the meantime.
One made the news. The other did not.
And it always works that way, by the way: the news is the rare event, the big number is the boredom nobody reports.
Where the flip is actually real
Now let me tell you the one thing in this piece you can use.
If you take the price of ether and divide it by the price of bitcoin, you get the famous ETH/BTC ratio. It is the clean way of asking which of the two is doing better, without the dollar dirtying your reasoning.
That ratio, back in May, sat around 0.024.
It now sits around 0.030.
There is your flip. It is there, not in the dollar price.
Ether gained roughly a quarter against bitcoin, and over the same period it lost value against the dollar. The two things sit together perfectly well, because they are two different bets.
And this is the real operational lesson, which has nothing to do with crypto and everything to do with any market you touch:
if you buy A because you think it will beat B, the right bet is A against B, not A against the dollar.
Whoever went long ether against bitcoin in May was right and took it home.
Whoever went long ether and nothing else had the exact same insight, was right on the thesis, and lost money anyway.
If one sentence survives this article, make it that one.
The explanation going around, and how much I buy it
The people who do this for a living tell it roughly like this: whoever sells bitcoin ETFs is selling exposure to a store of value that was not storing value, while whoever buys ether ETFs is buying an infrastructure that yields something, between 2 and 2.6 per cent net from staking, and on which stablecoins settle.
It is a coherent explanation. I quite like it too.
But let’s agree on what it is: it is a narrative that fits the data well, not a proof.
Narratives that fit the data well are the most dangerous ones out there, because they look like understanding when they are only telling the story backwards. If the ratio goes back to 0.024 tomorrow, all of us, me included, will find an equally elegant reason to explain it.
And August?
I am not going to comment on August, and I’ll tell you why.
In the first week of the month bitcoin ETFs collected over 750 million.
In the week around mid August almost 390 million left.
Two opposite headlines, both of them true, eight days apart.
Anyone quoting you a single week to prove that money is coming in, or going out, is picking the week that suits them.
It is the exact same flaw as the statistic I was talking about on Wednesday about levels: a figure without the period it was built from is not data, it is a position dressed up as data.
If you want to watch flows, watch them by month and by half year. Below that threshold it is noise, and noise makes you enter badly.
What I actually do with it
Not much, and let me be honest about it.
ETF flows are slow context. They tell you who is quietly accumulating over quarters, not whether you buy or sell tomorrow morning.
Asking flows for timing is like asking the clock in your living room what the weather is like outside.
What does change things, if you touch the crypto world at all, is size. Because here the “worst month ever” and the “best month ever” sit inside the same quarter, and the volatility behind those headlines is the same one that liquidates you at night while you sleep.
If you trade this with leverage, do the size calculation before you enter and keep it small: I put the Crypto Risk Manager online exactly for that, it is free and it tells you in ten seconds how much you can afford to be wrong by.
It is not the tool that makes you money. It is the one that keeps you at the table long enough for your thesis, if it is right, to have the time to become right.
Let me close where I opened
In July the question was: unlucky brother or compressed spring?
Today’s honest answer is a spring that is loading, but only slightly, and against bitcoin, not against the dollar.
The flip on flows is real and it is the first time. But it happened at all time lows for both of them, inside a half year in which billions left the sector, and the dollar price did not even wave at it.
If you want the full picture, the July piece on ether still stands on its premises, and the one on bitcoin and ETF flows is the frame right before this one.
An overtake at the lows of both is not a race won. It is a race where only one of the two stopped running.
And the moral, which is always the same one since I started writing on this blog.
Headlines give you the verb. Numbers give you the subject and the object.
If you only read the verb, you know something happened and you know neither to whom nor how much, and that is the stuff you go and open positions with.
Suerte Amigo!
Tiziano Brunno
Tradingblog
Want to put your market reading to the test?
Compete and challenge other traders inside an Arena in a demo environment, with no real capital at risk. Discover the Performance Arena Events by The Thunder Trader.
Disclaimer: purely informational and educational content. It does not constitute financial advice or an invitation to trade. Trading involves the risk of capital loss. Flow data quoted is current as of 18 August 2026.