
Posts

A stone staircase climbing through the darkness towards an amber glow at the top, between rocks and dark structures, with no end in sight

It was not a move. It was the start of a cycle.

Hi trader,

on 16 September the Fed raised rates for the first time in more than three years.

In the six days that followed the Nasdaq printed two record highs in a row and the VIX fell 20%.

If your reaction is “the market did not get it”, stop for a second. Because the numbers say the opposite: the market got it perfectly well, and what it got is more interesting than the hike.

Ok, vamos.

What happened, in three lines

Twenty-five basis points, from 3.50-3.75% to 3.75-4.00%. Vote unanimous, twelve to zero, no dissent. First hike after more than three years of standing still or cutting.

You read all of that everywhere on 16 September, and a week later it is worth nothing.

What is worth something sits in the projections the committee publishes alongside the decision.

The real headline is not 2026. It is 2027.

Alongside the decision, the committee publishes its own rate projections. Eighteen dots on a chart, which become seventeen on the years further out, because one participant did not submit projections for 2028 and 2029.

2026 is the part that ended up in the headlines: at least one more hike by year end, say sixteen dots out of eighteen.

But look at what happened to the years after that, comparing the September projections with the June ones.
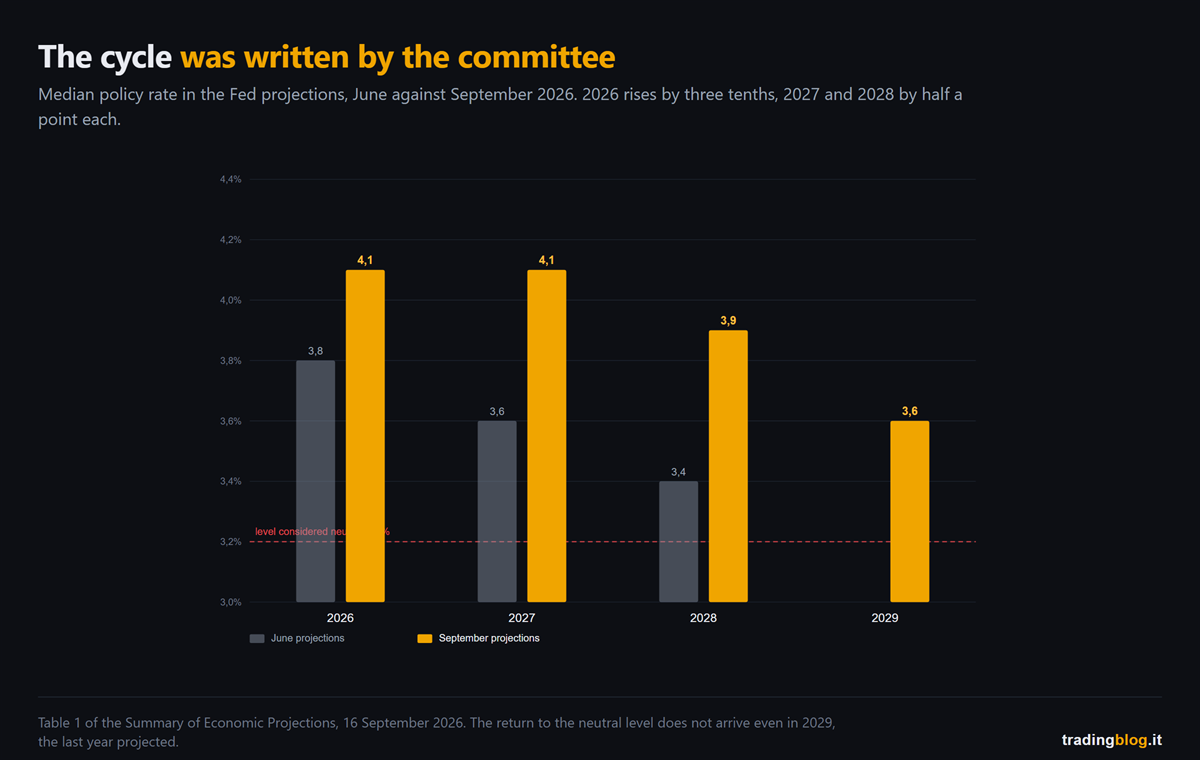
Bar chart comparing the median policy rates in the Fed projections from June and September 2026: every September bar is higher than its June counterpart, and none comes down to the line marking the 3.2% neutral level
The median rates in the committee’s projections, June against September 2026. 2026 rises by three tenths, 2027 and 2028 each rise by half a point.

The median for 2027 went from 3.6% to 4.1%. Half a point in three months.

The one for 2028 from 3.4% to 3.9%. Another half point.

And the trip back to the level they themselves consider neutral, 3.2%, never arrives at all. Not even in 2029, which is the last year projected: there the median does come down, but only to 3.6%.

Read it the way a trader would read it and not a journalist. The committee did not write “we hike once and then we see”. It wrote that rates go to 4.1% and stay there for two years, that in 2028 they come down to just 3.9%, and that at the end of the forecast horizon they have still not gone back to the level considered neutral.

That is not an isolated move. It is a high level held for years, written by the people who have to hold it. And in a moment you will see that the market expects even more than that.

And the market? It said they were right.

Here comes the part that flips your instinct.

When a central bank starts hiking, the script everyone expects is: equities down, volatility up, credit spreads widening, yields up all along the curve.

Between 16 and 22 September none of that happened. The numbers in this section sit inside that window, with two exceptions I flag as they come: the yield curve, which stops on the 21st, and the last data point, which measures the reaction of a single day.
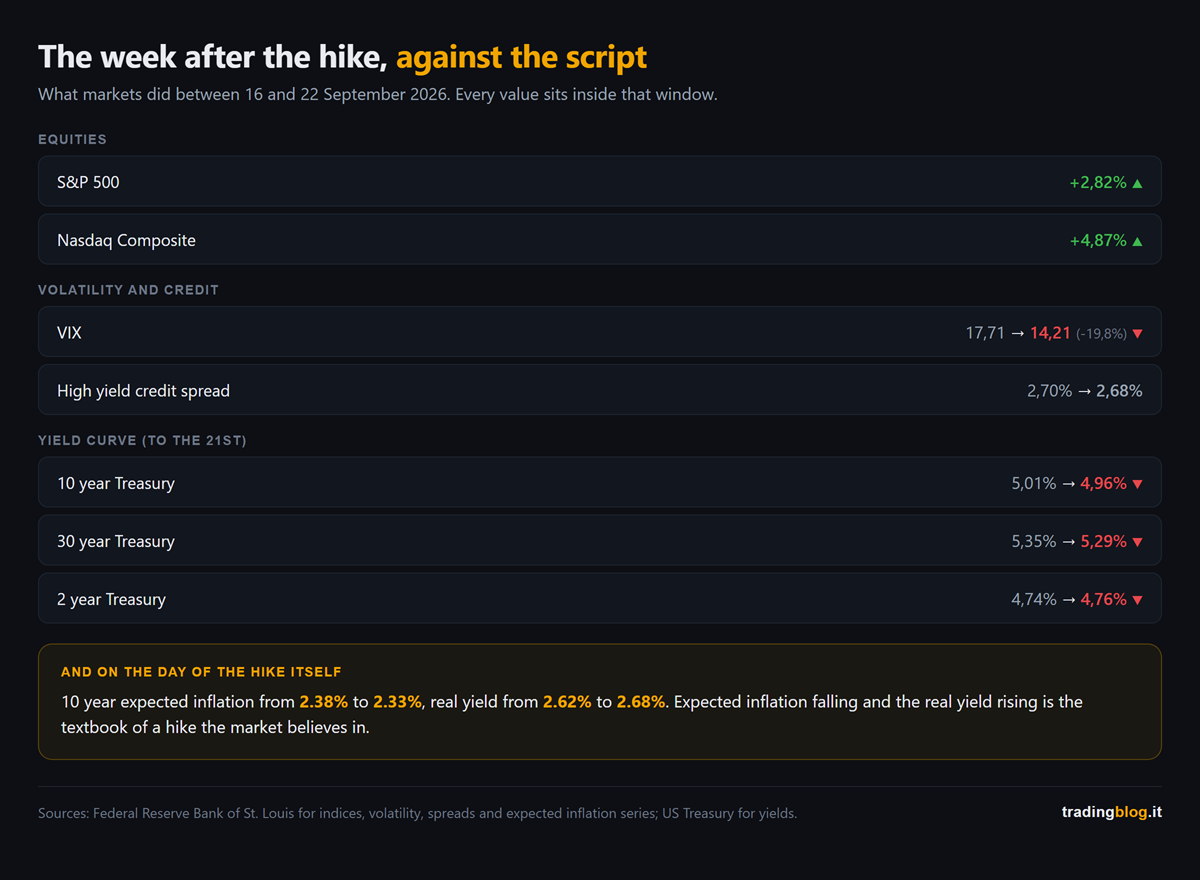
Table of market moves between 16 and 22 September 2026: equities up, volatility sharply down, credit spreads almost flat, ten and thirty year yields down and the two year yield up
What markets did between 16 and 22 September 2026. Equities up, volatility down, credit spreads flat, and yields lower all along the curve.

The S&P 500 did +2.82% and the Nasdaq +4.87%, with a record high on the 21st and another on the 22nd.

The VIX went from 17.71 to 14.21, so minus 20%, at the lows of the month. Anyone selling volatility on the day of the first hike in three years was right.

High yield credit spreads did not widen by a single point: 2.70% on the day of the hike, 2.68% on the 22nd. A credit market that fears a squeeze does not sit that still.

And now look at the yield curve, where the data stops on the 21st because that is the last day published.

The two year went up, from 4.74% to 4.76%. The ten year went down, from 5.01% to 4.96%, and the thirty year from 5.35% to 5.29%.

Short end up, long end down: the curve flattened by seven basis points. And it is the same thing the earlier numbers say, put another way: the market expects more tightening now and less inflation later.

But the number that explains everything is another one, and it is the subtlest. This is the only one that falls outside the window, because it measures the reaction of a single day: it compares the close on the 15th with the close on the 16th.

On the day of the hike ten year breakeven inflation fell, from 2.38% to 2.33%, while the real yield rose from 2.62% to 2.68%.

And now the honest part, the one they usually do not tell you.

Ten year breakeven inflation is very sensitive to oil, and crude started falling exactly around those days. So a slice of that drop may be the barrel, not the Fed. Anyone selling you only the first half of the number is selling you a thesis, not a measurement.

But oil does not explain the other half. Crude falling pushes breakeven inflation down, it does not push the real yield up. Those six basis points of extra real yield on the very day of the decision are the one thing the barrel cannot account for, and that is where the thesis holds up.

Breakeven inflation down and real yield up, together, is what happens when the market believes the central bank will do its job. It is the textbook of the hike that works, not of the one that scares.

The market did not ignore the Fed. It believed it.

Where the market does not agree

There is one point where market and committee see it differently, and it is not the one you think.

On the next meeting, 27 and 28 October, futures gave 54% odds to another hike as of 22 September. A coin flip.

But looking out to December, the probability of being at least twenty-five basis points higher is 90%.

On direction they agree. The disagreement is on the when, and on the how much.

Over the next nine meetings fed funds futures were pricing, as of 22 September, around eighty basis points of total tightening, so roughly three hikes. The dot plot median forecasts one.

The market is pricing a longer cycle than the one the committee put on the dots.

And the two things I have just written do not contradict each other, they hold together: the market expects more hikes than the committee forecasts, and that is exactly why it expects less inflation.

What changes for anyone trading inside the day

This is the part that really concerns you, and it has nothing to do with forecasts.

The Fed chair, in the press conference, said two things that put together change the job.

The first: “I’m not in the forward guidance business”.

The second, explaining how he looks at the data: “data point dependence is a dangerous preoccupation”. Trends count, he said, single numbers are noise.

And he does not put his own dot on the dot plot, as he already did in June.

Translated into practice: the guidance the market had used for ten years to price meetings has been switched off by the people who issued it.

The market will keep pricing every single data point though, because that is what the market does. So the reactions to macro numbers are still there, and my expectation is that they get wider: with a central bank that refuses to guide, nobody confirms them or denies them the day after.

For anyone trading inside the day that is a concrete asymmetry: the move on the number is there, the confirmation that used to come afterwards is gone. You trade the reaction, not the anticipation, and to do that you need to know when the number lands.

The dates that really count

They are not all the same, and two of them weigh more than all the others put together.

Friday 2 October, the September jobs report. The committee projects unemployment flat at 4.1% for the next four years, so it expects no cost on the labour side. A weak jobs number is the thing most likely of all to change the committee’s mind from the inside. With one honest caveat: the standard the chair has set himself is declaredly about inflation, not about employment.

Wednesday 14 October, September inflation. It is the last consumer price print before the meeting on the 28th, and the chair said in the press conference that he builds his own estimates precisely on that one and on producer prices. It is the number that decides whether the next hike is in October or in December, and on that day the coin flip I mentioned above resolves one way or the other. The day after, on the 15th, producer prices come out, the second of the two numbers the chair builds his estimate with.

And be careful not to get confused: that number does not decide the committee’s mind, it decides the price. The chair has just said that he does not look at single numbers. The market does, and that is where the odds move.

Before those, on Wednesday 30 September, the August PCE comes out. It serves to check an estimate the chair made out loud in the press conference, and if it comes in above, the squeeze gets firmer.

And one to write down: the 28 October meeting has no dot plot. Statement and press conference only. The next update to the dots is in December.

A note on what can go wrong

The chair gave three reasons for the hike: an economy stronger than expected, inflation not coming down enough, and geopolitics.

The third has already moved, but not in the simple way. Crude had spiked all the way to 107 dollars on 15 September, the day before the decision, and from there it came back toward ninety, pushed by the diplomatic openings on Iran and by the expectation that Saudi Arabia will restart a major pipeline.

Watch out though: that is the unwinding of a spike, not a collapse. The barrel is still above late August levels. If it falls further, part of the job gets done by oil from the outside without the committee having to change its mind. If it climbs back up, it puts back in play one of the very reasons they hiked.

A note, because the week has already turned

What you have read above is the week from the 16th to the 22nd. On the 23rd the wind changed: equities came off the highs and the ten year yield went back up toward 5%, precisely on the fear of more hikes.

It does not disprove anything. If anything it confirms the more uncomfortable part: the market is not pricing less tightening, it is pricing more.

The circle we close

On 11 September, on this blog, we wrote that the number that decides the Fed is not the headline one but the core, and we argued it with the projections the ECB published the day before, where from 2027 onward core stays above the headline.

Five days later the Fed hiked, and its projections say exactly the same thing from the other side of the Atlantic: headline inflation coming back down first, core lagging behind, and rates that as a result stay high for longer.

Two central banks, same diagnosis. If you missed that piece, Friday’s CPI: the number that decides the Fed is not the headline is where this conversation started.

Breakeven inflation falling and the real yield rising is not a market ignoring the central bank. It is a market that believes it.

— tradingblog.itPosta su X

Let me close with the thing I wrote down in my notebook that evening.

For ten years we traded inside a system where, after every data release, somebody turned up to tell you how to read it.

That somebody has just said he will not be doing it any more.

It is not good news and it is not bad news. It is simply that noise now stays noise for longer, and the job goes back to being reading the reaction instead of waiting for the explanation.

Suerte Amigo!

Tiziano Brunno

Tradingblog

Want to put your market reading to the test?

Compete and challenge other traders inside an Arena in a demo environment, with no real capital at risk. Discover the Performance Arena Events by The Thunder Trader.

Discover The Thunder Trader →


Disclaimer: purely informational and educational content. It does not constitute financial advice or an invitation to trade. Trading involves the risk of capital loss.


Nucleo di cristallo che emette un campo di forza con candele di vetro in orbita, concetto di gamma exposure

GEX Explained Simply: Why Some Days the Index Sits Still and Others It Crashes

Hi trader,

let me tell you about two days, take the same index, put it in the exact same context.

Day one. The price wakes up, ticks up a hair, ticks down a hair, and for eight hours it stays glued to a level like a barnacle on a rock. Every attempt to break higher gets sold, every little dip gets bought back. Deadly boring.

Day two. Same index. It opens lower, and instead of finding a cushion it finds thin air. Every bounce lasts three minutes and gets wiped out. The price doesn’t fall, it plummets.

The question is: what changed?

Often it’s not the news. It’s who is forced to buy and sell behind the scenes, without anyone asking them to, just to do their job. That “who” is the market makers, and the compass that tells us which way they’re pulling is called GEX, Gamma Exposure.

It’s calculated on the options of an underlying, usually the US indices like the S&P 500 (you’ll find it as SPX), or the ETFs that track them, like SPY, which tracks the S&P 500, and QQQ, which tracks the Nasdaq-100. In practice it tells you how much gamma the market makers are carrying on that market, and therefore which regime you’re in.

Now let me explain it without a single formula, promise.

Let’s start with the market maker

When you buy or sell an option, on the other side there’s almost always a market maker. He’s the one running the house, always ready to give you a price, to buy or sell at any moment.

But careful, he doesn’t want to bet on direction. He couldn’t care less whether the market goes up or down. He makes his money on the spread, on making the market, not on guessing where it goes.

The problem is that the moment he sells you an option, he’s left holding a directional exposure he never wanted. So what does he do? He neutralizes it. He goes to the underlying, the future or the index, and buys or sells just enough to get back to flat.

It’s called delta hedging. Covering. Put even more simply: every time the market moves, the market maker has to adjust his hedge to stay neutral.

There you go. Hold on to that picture, because that’s the whole thing: a guy forced to buy and sell the underlying non-stop, not because he believes in it, but so he doesn’t get caught leaning.

Gamma, without the jargon

Delta is how much the option moves when the underlying moves. Gamma is the speed at which that delta changes as the price runs.

Translated into practice: gamma is how often and how hard the market maker is forced to readjust his hedge.

And here’s where it gets good, because that readjusting can do two opposite things. It can slow the market down or it can step on the gas. It depends on which side of gamma the market makers are on as a group.

Let me put it in racing terms, which are mine.

The market makers’ hedge is like your car’s suspension. When it works well, you hit a pothole and the car soaks it up, you stay glued to the asphalt. When it’s shot, that same pothole sends you flying, you bounce, you lose grip, and on an icy downhill you leave your skin on the road.

Same asphalt, same pothole. What changes is the suspension.

GEX is the way to know, before you set off, whether today the market has good shocks or blown ones.

Why they hedge, and how they really do it

Let’s take it in order, because this is the heart of everything.

When market makers as a whole have positive gamma, their hedging leads them to do this:

  • the price goes up, they sell a bit of the underlying
  • the price goes down, they buy a bit of the underlying

They buy the dips, they sell the rips. They go against the move. They’re the shocks that work.

When instead they have negative gamma, the exact opposite happens:

  • the price goes up, they have to buy even more
  • the price goes down, they have to sell even more

They chase the move, they pour fuel on it. Blown shocks.

Same job, same people, opposite effect on the market. That’s the whole trick.

Positive GEX: the market that stabilizes itself

When GEX is clearly positive, the market makers act as a brake.

Every time the price tries to break away, their hedging pulls it back. Result: compressed volatility, small moves, plenty of mean reversion. The price glued to a level.

That’s day one of my example. The barnacle on the rock.

In practice
You’re in a positive gamma regime. The future opens, tries to break above a high, makes ten points and fizzles. Comes back inside. Tries to break below, another ten points, and bounces. It keeps going like that until the close, inside a tight range.
If that day you go hunting for explosive breakouts, you’ll get ground down by a thousand false signals. The market isn’t messing with you, it’s just telling you that today the ones who brake are in charge.

Negative GEX: the market that amplifies

When GEX turns negative, the scene flips. The market makers go from brake to accelerator.

The price falls, they sell, the price falls even more. The avalanche kicks in. Here come the gaps that don’t fill, the trends that accelerate, those air pockets where the market seems to be walking down the stairs with no handrail.

That’s day two. The void under your feet.

In practice
Same index, but below a certain level you’re in negative gamma. A sell order comes in, and instead of finding buyers it finds more forced selling. A move that on a normal day would be twenty points becomes eighty.
Here the breakout isn’t a false signal, it’s the day. And if you start buying the dip “because it dropped too much”, you’re trying to catch a falling knife.

Same strategy, two days, two opposite outcomes. Not because you’re better or worse. Because the regime is different.

The three levels that matter

GEX isn’t a single number, it’s a map. And on this map there are three points worth knowing.

Zero gamma, or gamma flip. It’s the borderline. Above it, the market tends to stabilize (good shocks). Below it, it tends to amplify (blown shocks). It’s the most important level of all, because it tells you which world you’re in.

Call wall. It’s the strike loaded with calls above the price. In a positive gamma regime it works like a ceiling, a resistance that tends to slow rallies down. The market gets up under it and struggles to punch through.

Put wall. It’s the strike loaded with puts below the price. It tends to act as a floor, as support. But watch out: if the price breaks through it, that’s often exactly where you slide into negative gamma territory, where there’s air underneath.

Zero gamma, ceiling, floor. Three levels, and you’ve already got an idea of where the price breathes and where it risks running.

How you actually use it (read this part carefully)

Here I have to be blunt, because this is where people get it most wrong.

GEX is not an entry signal. It’s the regime context.

It doesn’t tell you “buy here” or “sell there”. It tells you what kind of day you’ve got in front of you, and therefore how you should behave. It’s the difference between driving on dry roads and driving on wet ones: it doesn’t change where you want to go, it changes how you get there.

In a positive gamma regime:

  • expect range and mean reversion
  • breakouts tend to fail, so distrust the breaks
  • targets are shorter, the market won’t hand you the big move

In a negative gamma regime:

  • expect moves to have follow-through
  • trend and momentum work, “it dropped too much” doesn’t
  • volatility is higher, so keep your size smaller and your stop wider, otherwise the noise shakes you out

See what changes? Not the entry. What changes is size, stop and type of strategy. That is, the three things that decide whether you survive.

And here’s the uncomfortable truth. This map, the gamma flip, the call wall, the put wall, a lot of people don’t have it in front of them. They trade in the dark, then they’re surprised when the breakout fails on them five times in a row.

Working it out by hand from the open interest is a brutal pain. That’s why we put it inside Thunder Desk: gamma exposure on the S&P and Nasdaq, updated, free, without you having to download an options spreadsheet and pray. You open it, you look at which regime you’re in, and you already know whether today you go hunting for range or for trend. No noise, just data.

This isn’t a banner I’m selling you. It’s the difference between knowing it’s going to rain before you head out, or noticing when you’re already soaked.

The limits (because it’s not a crystal ball)

Now the cold shower, which is only fair.

GEX is an estimate. It’s built on the open interest of the options, that is, on how many contracts are open at each strike. But to turn that into “the market makers are long or short gamma” you need an assumption about who bought and who sold each piece.

And that assumption can be wrong. It’s not always the case that whoever bought that call is a client and whoever sold it is a market maker. The models make a reasonable average, but it’s an average, not an X-ray.

On top of that, the picture changes after OPEX, the monthly options expiration. When that mountain of contracts expires, the gamma resets and rebuilds from scratch. A level that held beautifully on Thursday can evaporate the Monday after expiration.

So treat it for what it is: a compass on the regime, not a GPS that drives you into the parking spot.

Where I learned it

One thing I think is only fair to say, because I did not invent GEX myself.

I learned this material from Enrico Stucchi, and if today I can lay the picture out for you in plain words, the credit is his.

And here comes the most important thought in this whole article. In this job the humility to go back and study is not optional, it is a working tool: whoever stops learning has not arrived, they have just fallen behind without noticing.

Always look for someone who knows more than you do, and stay close to them. It costs a lot less than the price you pay for staying convinced you already know everything.

Three things to take home

  1. GEX tells you whether the market makers today are braking the market (positive gamma, range) or amplifying it (negative gamma, trend and sharp moves). It’s the regime, not the signal.
  2. Three levels are enough to orient yourself: zero gamma (the border), call wall (the ceiling), put wall (the floor).
  3. It doesn’t change where you enter, it changes how: size, stop and type of strategy. And it’s an estimate, not an absolute truth, so watch out for OPEX.

And here I’ll leave you a hook for the next piece, because there’s something that in recent years has made this whole picture a lot more jittery.

Until not long ago you calculated gamma on the weekly and monthly expirations, fairly stable stuff. Then the options that expire same-day arrived, the 0DTE, and they sent intraday gamma on a roller coaster: it builds up and resets within the same session, and the map you had in the morning is already a different one by noon.

We’ll talk about them in the second article of the series, entirely dedicated to them:

Read the second piece: 0DTE, the options that expire same-day

One last thing, just so we understand each other. The Events on The Thunder Trader run on forex, CFDs and crypto, in a demo environment, with no real capital at risk. GEX, on the other hand, is born on the index options, on the future. They look like two distant worlds, and yet knowing how to read the regime of the underlying is a competitive edge you carry with you everywhere, because when the future goes into negative gamma the rest of the risk doesn’t exactly sit still. It all moves together.

If you want to start from the basics in an orderly way, in the free ebook Win the Arena you’ll find the method step by step. Then put the Desk in front of you, and you never enter in the dark again.

I’ll wrap it up here. If you know someone who complains that “the market some days has gone crazy”, send them this article. Maybe it hasn’t gone crazy, maybe it just changed its suspension.

Suerte Amigo!

Tiziano Brunno

Tradingblog


Disclaimer: purely informational and educational content. It does not constitute financial advice nor an invitation to trade. Trading carries the risk of capital loss.