Posts

A lighthouse on a cliff at night lights up a bay full of cargo ships at anchor, backlit in amber.

The COT report, how to actually read it

Hi trader,

the first time I opened a COT report on the S&P I nearly had a heart attack.

Hedge funds were short. Heavily short, hundreds of thousands of contracts.

In my head the movie was already written: the big guys know something, they’re about to crash everything, and there I am, long like a sitting duck.

Nothing crashed.

And the week after, they were still short. And the week after that too.

Then I went and looked at the history, and found out the thing nobody had told me: on the S&P future, leveraged funds are short almost all the time. From January 2016 to the report of 29 September 2026, out of 561 weekly reports, they were net long 15 times. The last one on 8 March 2022.

That day I realized I hadn’t read the COT. I’d just looked at it.

In the piece on the four questions before opening the chart I gave you the short version. And in the crypto lesson on what moves the price I told you that funding is NOT the COT. Today I’ll explain what the COT is, and above all how to read it without getting hurt.

Ok, vamos.

What it is, in four lines

The Commitments of Traders is published by the CFTC, the agency that oversees US futures.

The positions of the big players, the ones above certain thresholds, are reported to the CFTC every day. Once a week the CFTC publishes the aggregate snapshot, split by categories.

The snapshot is taken at Tuesday’s close. It’s published on Friday at 15:30 New York time, which for us in Europe means the evening. Holidays aside, which shift the calendar.

And it only exists for markets where at least 20 traders sit above those thresholds. On ES that’s not a problem.

Which report: the detail that changes everything

This is where the first fool trips up, and I was the fool.

There’s more than one report.

The Legacy is the oldest, and it splits the world in two: commercial, meaning those who use futures to hedge a risk from their own business, and non commercial, meaning everyone else. It’s the one you see quoted everywhere.

The Disaggregated is built for commodities: it separates producers and processors, swap dealers, funds and the rest. On oil, wheat and gold it makes sense.

The Traders in Financial Futures, TFF to its friends, is built for financial futures: stock indices, currencies, rates. If you trade ES or NQ, this is the one you need to look at.

And careful, because the CFTC says so itself: the TFF is not a more detailed version of the Legacy. Its categories can draw from both the commercial and the non commercial side. So “commercial = the people who deal in the goods”, which works on oil and wheat, gets you nowhere on the S&P. Nobody manufactures the S&P 500 in a warehouse.

I know, in the four questions piece I talked to you about commercials and speculators. On oil and wheat that still holds. On indices, today I’m taking you one step further.

The four families of the TFF
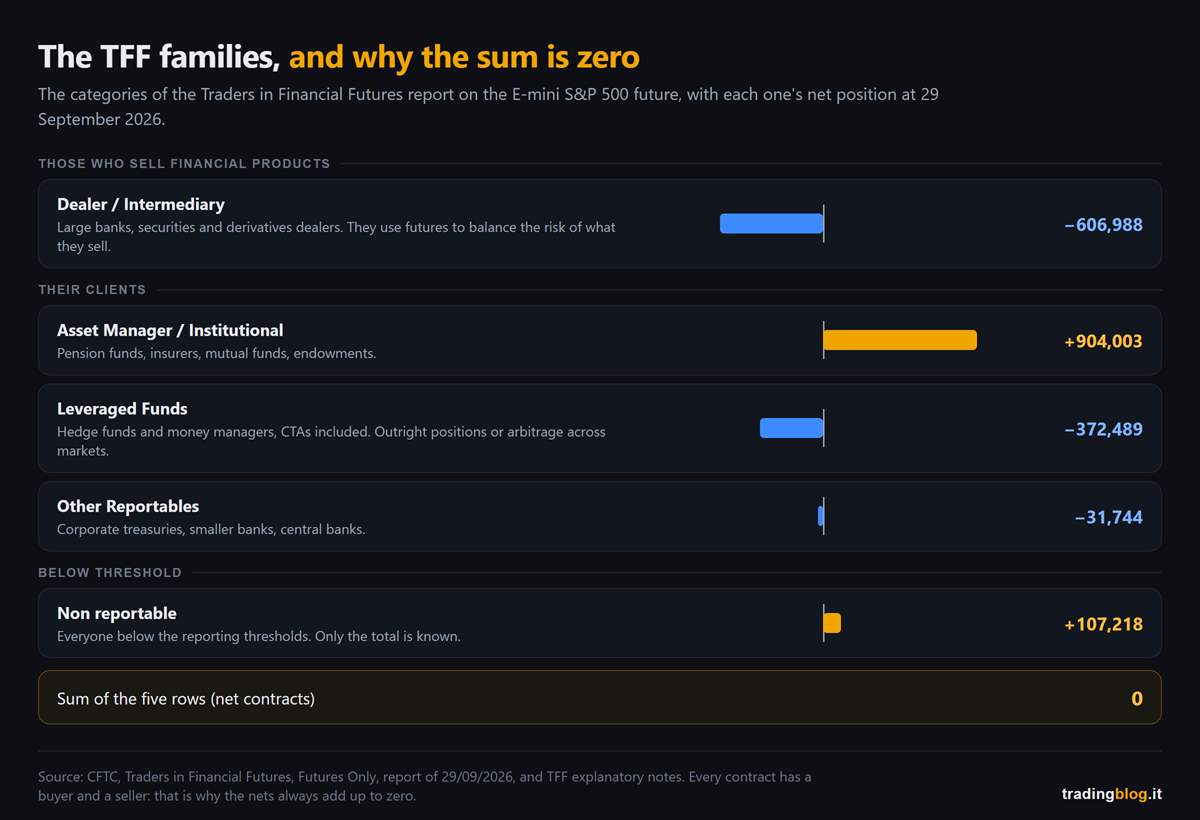
Diagram of the categories of the Traders in Financial Futures report on the E-mini S&P 500 future at 29 September 2026: dealers net short 606,988 contracts, asset managers net long 904,003, leveraged funds net short 372,489, other reportables net short 31,744, non reportable small traders net long 107,218. The sum is zero
The TFF report categories on the E-mini S&P 500 future, with each one’s net position as of 29 September 2026. On one side the sellers of financial products, on the other their clients. The total always adds up to zero.

Let me explain it properly, with the CFTC definitions translated into human.

Dealer/Intermediary. The sell side: big banks and dealers in securities and derivatives. They build products for clients and use futures to balance the risk of what they’ve sold. Usually they’re not betting, they’re hedging the house.

Asset Manager/Institutional. Pension funds, insurers, mutual funds, endowments. Slow, big money.

Leveraged Funds. Hedge funds and various money managers, CTAs included. The CFTC writes that their strategies can be outright positions or arbitrage between different markets. Keep that in mind, you’ll need it in two minutes.

Other Reportables. The ones above the threshold who don’t fit the other three: corporate treasuries, smaller banks, central banks.

Plus a fifth row: the non reportables, meaning everyone below the threshold. The small fry. The CFTC only knows their total, not who they are.

Two words you need to have clear

Net position. Long contracts minus short contracts, by category. If asset managers have one million one hundred thousand longs and two hundred thousand shorts, they’re net long around nine hundred thousand.

Open interest. The CFTC defines it as the total of contracts open and not yet closed. Every contract has a buyer and a seller, which is why the net positions of all the categories, added up, come to zero. Always. If someone is net long, someone else is net short by the same amount.

Look at what ES open interest does around an expiry. On 8 September 2026 it was 2,071,836 contracts. On 15 September, three days before the quarterly expiry on the 18th, it was 2,446,519. On 22 September, after expiry, 1,890,653.

That’s not a wave of new money followed by a stampede out. It’s the rollover: for a few days the expiring contract and the new one live side by side, and the numbers swell.

The real example: ES over the last three years
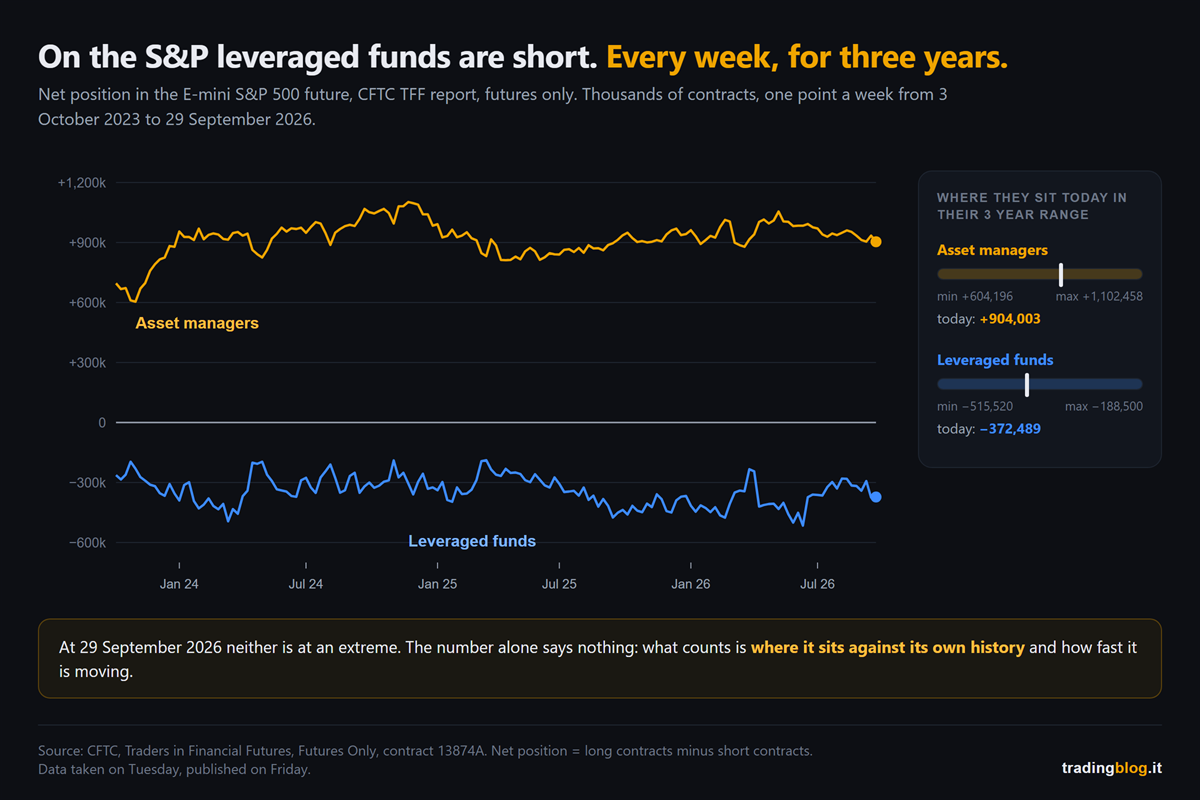
Chart of the net position of asset managers and leveraged funds in the E-mini S&P 500 future in the CFTC TFF report, from 3 October 2023 to 29 September 2026: asset managers always net long between 600 thousand and 1.1 million contracts, leveraged funds always net short between 190 thousand and 515 thousand, and on the right today's position within the three year range, away from the extremes
Net position of asset managers and leveraged funds on the E-mini S&P 500 future, weekly TFF report from 3 October 2023 to 29 September 2026. The former always net long, the latter always net short. On the right, where they sit today within their three-year range.

As of the report of 29 September 2026, the latest available as I write:

asset managers are net long 904,003 contracts;

leveraged funds are net short 372,489 contracts.

Read like that, the second number is scary. It’s the same one that scared me.

Now put it inside its history. Over the last three years the leveraged funds’ net position has gone from a low of -515,520 (16 June 2026) to a high of -188,500 (18 March 2025). It has never been positive. Today it sits a bit below the middle of its range.

And look at the dates. The low and the high both fall in the week of a quarterly expiry. Exactly the weeks I’m about to tell you to be wary of.

Asset managers, over the same period, went from 604,196 (31 October 2023) to 1,102,458 (26 November 2024). Today they’re a good way past the halfway mark.

Translated: this week the COT on ES isn’t telling you anything special. No extremes, no rush.

And you know what? I ran the numbers from 2016. In roughly three weeks out of four, neither asset managers nor leveraged funds sit at the edges of their three-year range. Most weeks the COT has nothing to tell you, and that’s fine.

The four classic mistakes

One: using it for intraday timing. It’s a weekly snapshot of aggregate positions. Inside it are players who think in months. Asking it where ES is going at 15:45 on Thursday is like asking the seasonal weather outlook whether you’ll need an umbrella at five.

Two: forgetting the delay. Snapshot from Tuesday evening, published Friday evening. If you read it on Monday morning, the data is almost six days old. In six days a leveraged fund can have flipped everything twice.

Three: mixing up who hedges and who bets. This is the one that got me at the start. The CFTC says it in black and white: it classifies traders, not individual trades. It knows a hedge fund belongs in leveraged funds, but it can’t know whether everything it does is speculation. A fund short the future can be long the stocks and pocket the difference between the two prices. Direction may mean nothing to it. That’s why “funds are short” on the S&P doesn’t necessarily mean “funds are betting on a drop”.

Four: looking at the level instead of the extremes and the changes. Minus 372,000 contracts, on its own, means nothing. It only becomes information when you compare it with that category’s history: is it near the edge of its range? Has it been moving fast in one direction for weeks? And even then, watch out for rollover weeks, where the numbers jump around for reasons that have nothing to do with positioning.

How I use it

I told you in the four questions piece and I’ll say it again: for me the COT is context, never a signal.

It tells me what room I’ve walked into. If a category is crammed at one extreme of its history, I expect that on the day it decides to leave, the door will be narrow. I don’t know when, and the COT will never tell me.

It doesn’t get me in. It doesn’t get me out. It just makes me more careful with my trade management.

And here’s a practical thing. The calculation I did above, meaning where a position sits today within its range, is mind-numbingly boring to redo by hand every Friday. In Thunder Desk you’ll find it already done, in an index from 0 to 100 over the last three years, free, you just need to sign up. Just know that there the calculation is done on the Legacy speculators, the non commercials, and as a proportion of open interest. So on ES and NQ it’s a rougher thermometer than the TFF I’ve walked you through today, and the numbers won’t match the ones above. For a first look it’s fine. To understand who’s behind it, open the TFF.

What you do starting tomorrow morning

On ES and NQ open the TFF, not the Legacy. They’re two different reports, and the categories don’t translate from one to the other.

Before reading a number, look at its history. A net position only makes sense within its range.

Note the date of the snapshot, not the date you read it. Tuesday, always.

In quarterly expiry weeks, take everything with a pinch of salt.

The COT doesn’t tell you when to get in. It tells you what room you’ve walked into, and how narrow the door is.

— tradingblog.itPosta su X

Back to that first time.

Funds were short, and I had seen a signal.

They were short the way they almost always are, and the signal was only in my head.

The COT is an honest tool: it tells you exactly what’s written in it, no more, no less. The problem is us, reading into it what we want to find.

Suerte Amigo!

Tiziano Brunno

Tradingblog

Want to put your market reading to the test?

Compete and challenge other traders inside an Arena in a demo environment, with no real capital at risk. Discover the Performance Arena Events by The Thunder Trader.

Discover The Thunder Trader →


Disclaimer: purely informational and educational content. It does not constitute financial advice or an invitation to trade. Trading involves the risk of capital loss.


The trader of the future with the amber visor standing at the centre of four holographic panels floating in the fog, each with a different glowing symbol: a balance scale, a calendar grid, a curve crossing an axis and a volume histogram with one bright band

Before I open a chart I ask myself four questions

Hi trader,

for years I opened the platform at nine and watched what happened.

It sounds like the mark of a real discretionary trader, somebody who reads the market live and does not let opinions get in the way. It even sounds good.

The problem is that the bad days almost never started at nine.

They started from the fact that at nine I did not know what film I had walked into. I did not know a number was coming out at 14:30, I did not know I was in a week where the market had no intention of going anywhere, I did not know that the level I was about to short was the same one where everything had stopped three weeks earlier.

Then I built myself a routine.

Ten minutes, four questions, before touching a chart. I do not predict anything and I do not decide anything. I just narrow down what it is reasonable to expect.

Today I am giving you the whole thing, with the questions in order, because the order matters.

Ok, vamos.

Two lines of transparency before we start

I get the answers to the four questions from one place, the Thunder Desk, which is The Thunder Trader’s free dashboard. So it is ours, and it is only right that you know that before reading the rest rather than after.

It is free, there is nothing to buy inside it, and to get in you need a name, an email and a password, with the email confirmed by clicking the link you receive.

That said, the four questions hold up anyway, even if you go and dig the answers out by hand across four different sites the way I did for years. The Desk took the collecting work off me, not the thinking. The thinking is the part that concerns you, and it is most of this article.

Question 1: which side is the guy with his hands on the goods?

Every Friday the CFTC publishes the Commitments of Traders, that is, how the large operators are positioned on futures.

Two families matter.

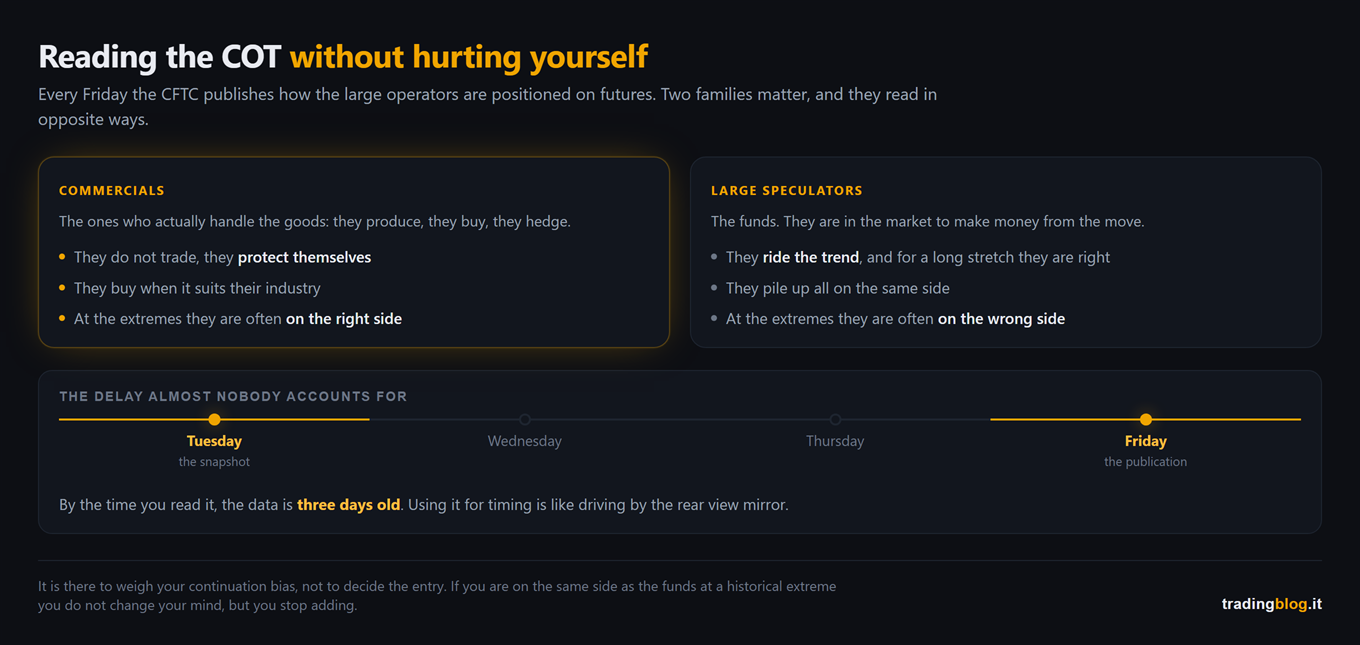
Commercials are the ones who actually handle the goods: whoever produces oil, whoever buys wheat, whoever has to hedge a currency. They are not there to trade, they are there to protect themselves, and that is what makes them interesting, because they buy when the price is low for industrial convenience, not out of enthusiasm.

Large speculators are the funds. They ride the trend, and they tend to be right for a long time and wrong at the extremes.

The Desk takes this stuff, which in its original format is an indigestible table, and boils it down to an index from 0 to 100.

Now the part that actually matters, which is how not to use it.

It is not an entry signal. Extreme positioning can stay extreme for months, and in the meantime price carries on perfectly happily in the direction you reckon should be reversing. Anybody who shorts because “commercials are record short” is betting on nothing.

And remember the delay. The data is a snapshot taken on Tuesday and published on Friday afternoon. By the time you read it, it is three days old. Using it for timing is like driving by the rear view mirror.

I use it for one thing only: to weigh my continuation bias. If I am long in a market where the funds are piled up on my own side at a historical extreme, I do not change my mind, but I stop adding and I tighten how I manage it.

Question 2: what can break the week, and at what time?

This is the dumbest of the four questions and it is the one that has saved me the most money.

You do not need to predict the number. Nobody can, and anybody telling you otherwise is selling you something.

You need to know the time.

The value of the calendar is defensive: not being in the market thirty seconds before a release that in two minutes does fifty points in a direction decided at random. It is not analysis, it is hygiene.

In the Desk the events come with the impact and with an explanation of what they mean, which is the part missing from almost every calendar out there: knowing that a number is coming is worth nothing if you do not know why that number matters and what the market is expecting.

If you want to see how a release gets read before it comes out, we did a worked example with the US jobs report.

The rule I apply, and I suggest you steal it: before every entry, I check whether anything is coming in the next thirty minutes. It costs three seconds.

Question 3: is the market glued down or free to run?

This is the question almost nobody asks, and it is the one that explains why some days feel cursed.

Whoever sells options has to hedge, and they hedge by buying and selling the underlying as price moves. The direction of that hedging is not always the same, and it changes everything.

When dealers are long gamma, to stay hedged they have to buy when the market drops and sell when it rises. The result is a market that puts itself out: days compress, moves get pulled back, highs do not last.

When they are short gamma, the opposite happens: they have to sell into weakness and buy into strength. Instead of being absorbed, the move gets amplified, and those are the days when everything happens faster than you expect.

The Desk gives you the three numbers you need to work out which of the two worlds you are in: Net Gamma, the Zero Gamma threshold where you cross from one regime to the other, and the two walls, Call Wall and Put Wall, the zones where so much of this stuff piles up that they often act as a ceiling or a floor.

Careful about what it is telling you, though, because this is the classic misreading.

It does not tell you the direction. It tells you the character of the day. It is the difference between knowing where the car is going and knowing whether the road is tarmac or ice.

We explained it properly in the piece on gamma exposure, and if you are interested in why certain days explode in the last hour, part two is in the piece on zero days to expiry options.

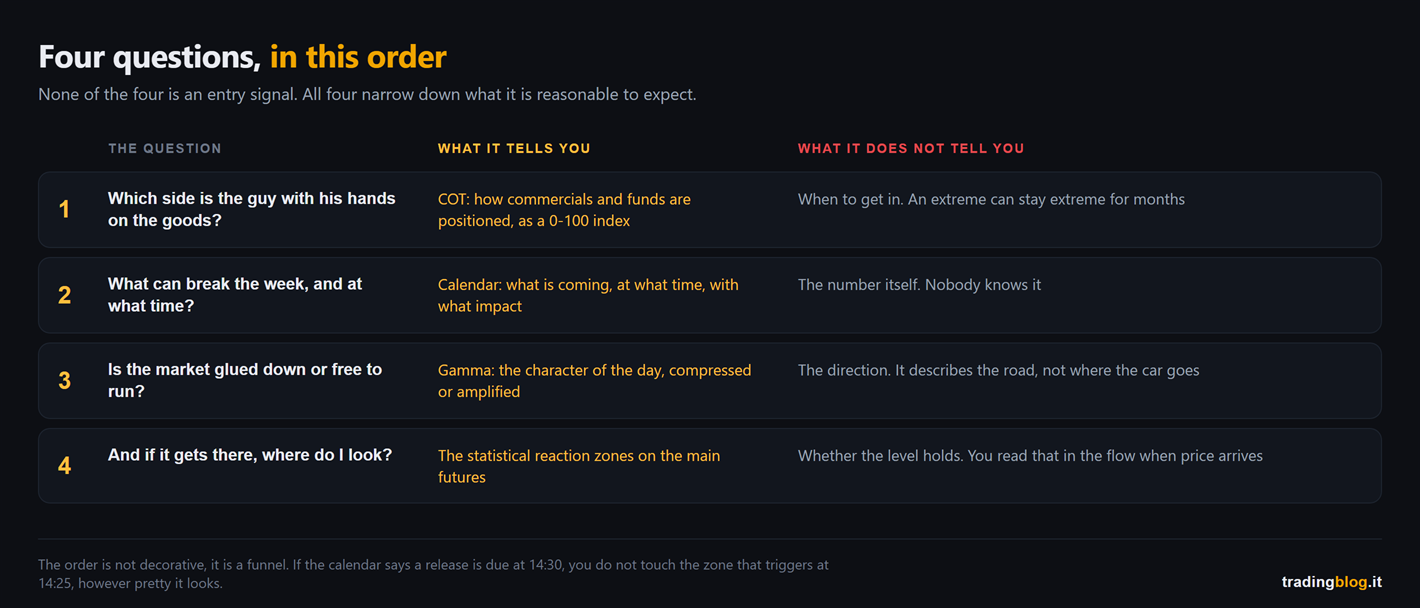
Table of the four preparation questions, numbered in order: COT positioning, the macro calendar, the gamma regime and the reaction zones, with what each one tells you and what it does not tell you alongside, because none of the four is an entry signal
The four questions in order, and for each one what it tells you and above all what it does not tell you. None of the four is an entry signal, all four narrow down what it is reasonable to expect.

Question 4: and if it gets there, where do I look?

Last, and it comes last for a reason.

A level on its own has never saved anybody. We said it two weeks ago talking about the value area and the VPOC: the level is not the signal, it is the place worth looking at.

The Desk puts the statistical reaction areas on DAX, ES, NQ and the Dow, so you get to the open knowing where the hot spots are instead of finding out while price is banging into them.

Then the reading is on you, and you do it with what we built over the summer: when price arrives at the zone, the question is always the same, who is in a hurry and who is sitting still waiting. Which is the whole point of bid/ask candles and of CVD.

Why the order matters

The four questions are not a shopping list, they are a funnel. Each one narrows the next.

If positioning says everybody is on the same side, I know the surprises will come from the other one.

If the calendar says there is a release at 14:30, I do not touch the zone that triggers at 14:25, however pretty it looks.

If gamma says we are in a compressed regime, the target I had marked sixty points away probably is not getting hit today, and my plan has to be built around that.

And only at the end do I look at the levels, which without the first three answers are just lines on a screen.

Comparison between commercials and large speculators in the COT report, showing what each group does and how they behave at the extremes, and below a timeline showing the three day gap between the Tuesday snapshot and the Friday publication
How to read COT positioning without hurting yourself: the two families that matter, what an extreme actually means, and the three day gap between the snapshot and the publication.

What the Desk does not do, stated plainly

It does not give you signals. It does not tell you to buy or sell. It has no view on where the market is going tomorrow, and if it did I would not tell you anyway.

It is a place where four pieces of information that normally live on four different sites live on one screen, updated every day, with a note next to them saying what they mean.

The rest, which is the decision, stays yours. Which is also what their disclaimer says, and for once it is not a disclaimer put there for the lawyers: statistical and informational data for educational purposes, no advice and no signals.

How you get in

Go to desk.thethundertrader.com, create the account with name, email and password, and confirm by clicking the link that lands in your inbox. If you do not confirm you do not get in, so check your spam folder too.

Inside there is a language selector at the top: Italian, English and Spanish.

What you do from tomorrow morning

One thing only, and it is not about the Desk.

Take ten minutes before the open and answer the four questions in writing. Four lines, not an essay. Which way is positioning, what is coming out and when, what regime this is, where the levels are.

Then in the evening reread those four lines next to how the day actually went.

Do it for two weeks and something annoying will happen: you will find out that a good share of the trades that hurt you were already ruled out by your own four lines, written that morning, by you. You had just ignored them.

That is exactly what happened to me, and it was more useful than any new indicator. If you keep them in your diary rather than on a scrap of paper, in a month you have a statistic instead of a memory.

The chart tells you where price is. It does not tell you what film you walked into.

— tradingblog.itPosta su X

Let me close with the thing that convinced me to stop improvising in the morning.

It was not a big loss. Big losses hurt but teach you little, because they tell you that you were unlucky.

It was a run of small losses, all identical, all in the same place: entered well, technically right, ten minutes before a macro release I had not looked at.

I was not missing a method. I was missing ten minutes.

Suerte Amigo!

Tiziano Brunno

Tradingblog

Want to put your market reading to the test?

Compete and challenge other traders inside an Arena in a demo environment, with no real capital at risk. Discover the Performance Arena Events by The Thunder Trader.

Discover The Thunder Trader →


Disclaimer: purely informational and educational content. It does not constitute financial advice or an invitation to trade. Trading involves the risk of capital loss.