Friday’s NFP: this time bad news is not good news
Hi trader,
on Friday at half past eight in the morning, New York time, the US employment data comes out.
Nothing new so far. First Friday of the month, the payrolls, the chart sitting still all morning and then doing in ninety seconds what it hasn’t done in three days.
Except this time there’s a detail almost nobody will mention in Friday afternoon’s headlines.
The reflex they taught you, “weak data, the Fed cuts, stocks celebrate”, doesn’t work this year.
In fact, it could cost you dearly.
Let me walk you through it properly, because there are a couple of things to line up first.
What comes out on Friday, and when
The report is called the Employment Situation, it’s published by the Bureau of Labor Statistics, and it covers the month of July.
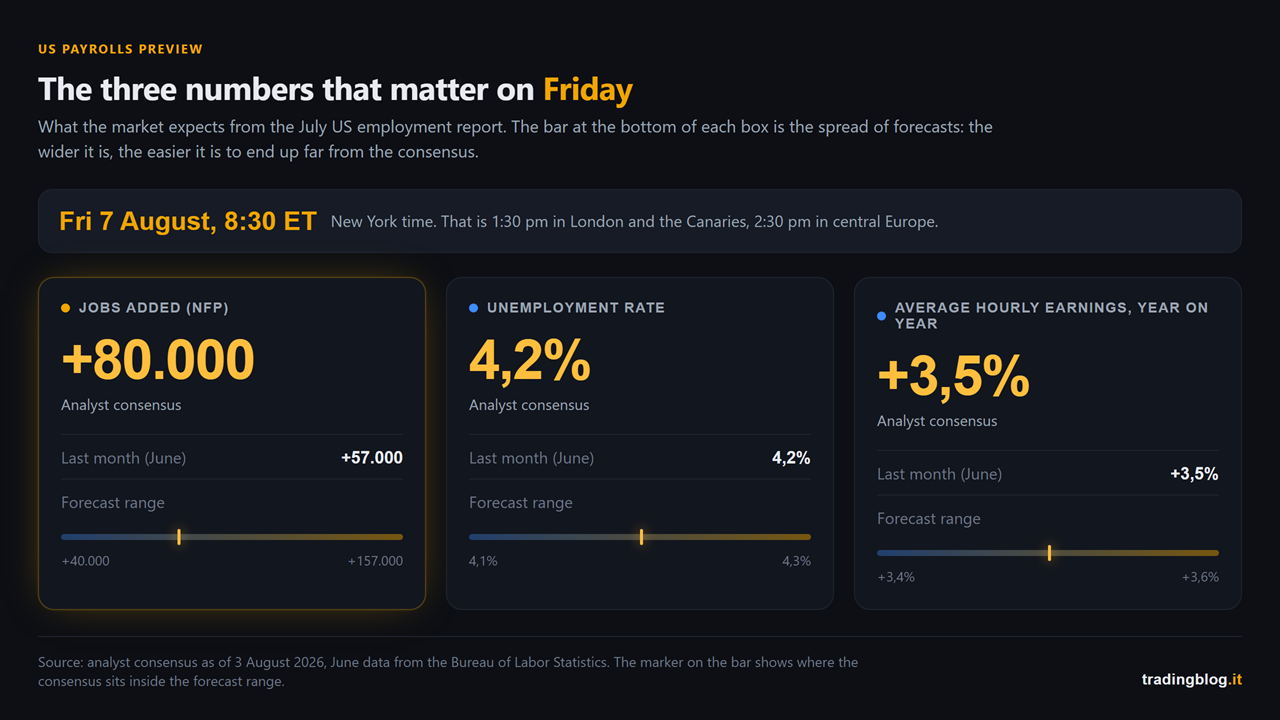
It lands on Friday 7 August at 8:30 am New York time, which is 1:30 pm in London and the Canaries, and 2:30 pm in central Europe.
Inside it there are three numbers that move price:
| What | Expected | Last month |
|---|---|---|
| Jobs added (NFP) | +80,000 | +57,000 |
| Unemployment rate | 4.2% | 4.2% |
| Average hourly earnings, year on year | +3.5% | +3.5% |
The consensus on jobs is +80,000, but the spread of forecasts is wide: it runs from 40,000 to 157,000. Deutsche Bank sits low, around 65,000. UniCredit sits high, around 110,000.
Translation: nobody actually knows. With 117,000 jobs between the lowest estimate and the highest, anyone positioned on the consensus can end up a long way from the real number.
On the unemployment rate the consensus is 4.2%, with some seeing 4.1% and some 4.3%.
On wages, +3.5% year on year, basically flat.
The context that flips everything around
Right, now the part that matters.
On 29 July the Fed left rates where they were, between 3.50% and 3.75%. Fifth time in a row. Boring so far.
But look at how they left them there: a 9 to 3 vote, with three members voting against because they wanted to raise them.
Not cut them. Raise them.
Three dissents all in the same direction hadn’t happened since September 2016. And Kevin Warsh, at the press conference, said the Fed “will deliver price stability” and that, where necessary, it will not hesitate to act.
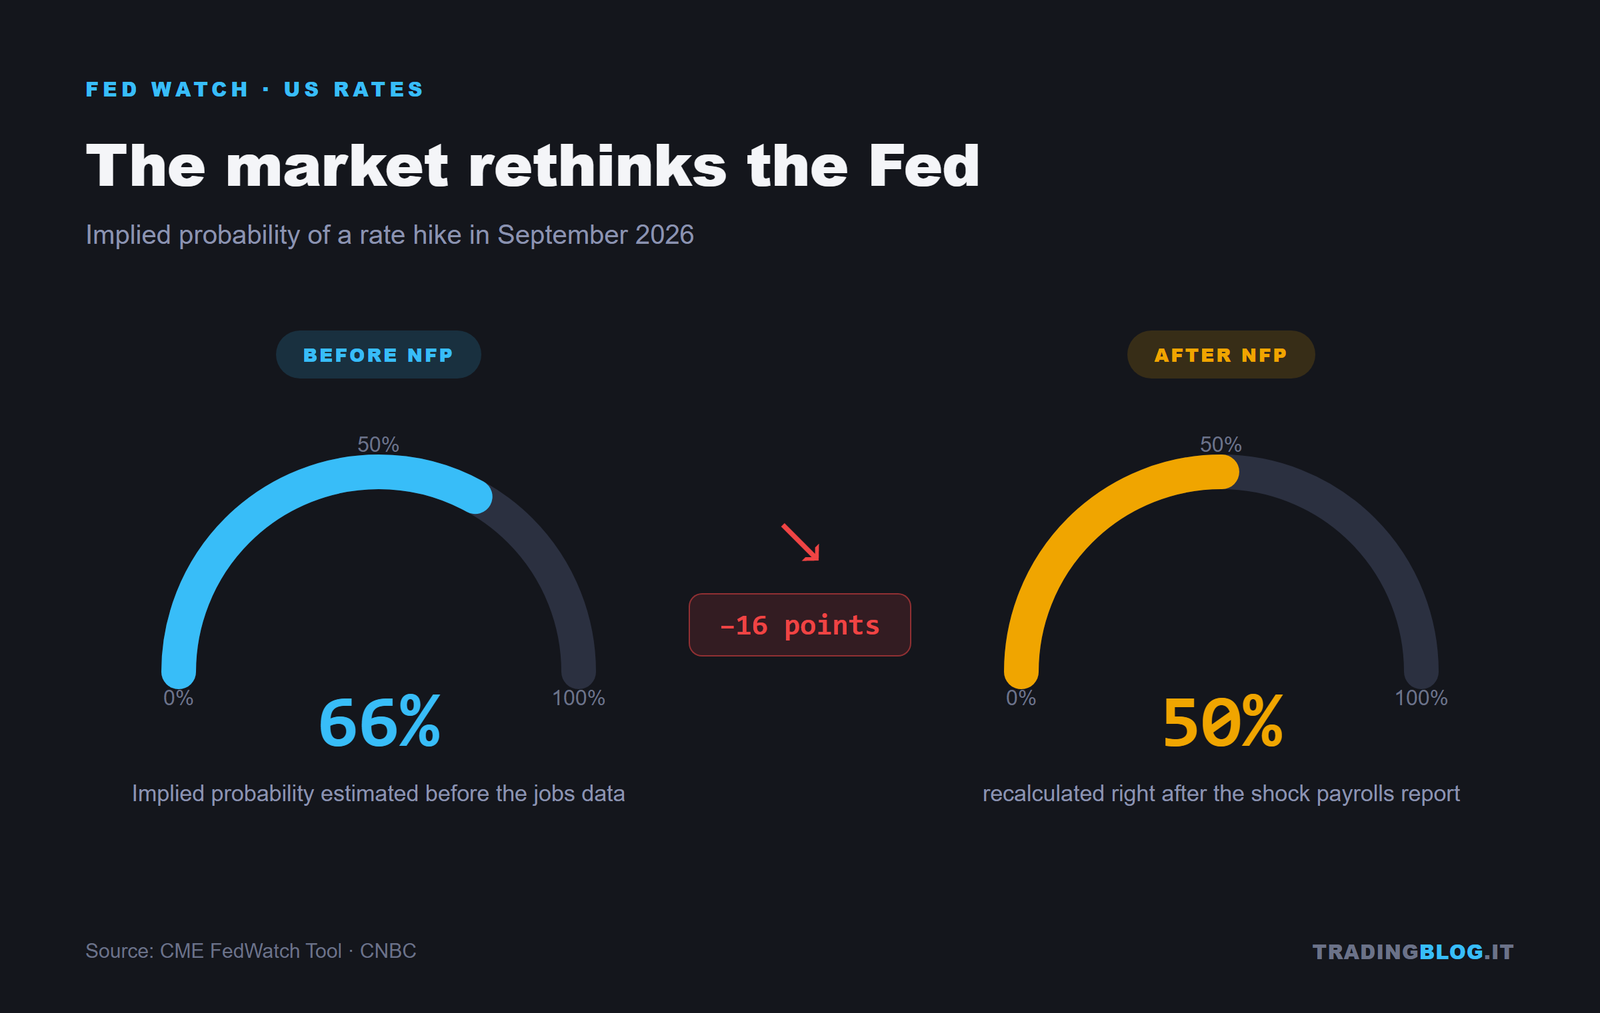
The result is that the market today is not pricing a cut in September. It’s pricing a hike, with a probability that was running around 55-65% at the start of the week and that moves every day along with the price of oil (the Strait of Hormuz negotiations have pushed crude down, and part of that probability with it).
The US 10-year yield is sitting around 4.6%.
You can see where this goes, right?
If the Fed is thinking about hiking because of inflation, weak employment data doesn’t automatically hand it a cut. It hands it a problem. Because inflation is still there, pushed by energy, and meanwhile the labour market is slowing.
That’s called stagflation, and it’s the scenario markets hate most. There’s no helping hand from the central bank coming to save you.
(I wrote about the end of July meeting and Warsh’s tone here: the Fed on 29 July, what to watch. It’s the backdrop to this whole piece.)
The clues already out this week
We’ve had two tasters already.
The first: yesterday’s ADP. It’s the private sector jobs report that comes out two days before the payrolls. In July it printed +44,000, against the 70,000 expected. It’s the weakest reading since January.
A word of caution though, and I have to be straight with you: ADP is not a good predictor of the payrolls. That’s not me talking, ADP writes it themselves at the bottom of their release, where they specify that the report isn’t designed to forecast the BLS number. They’re two different surveys with different methods (ADP counts who is on the payroll, the BLS counts who actually got paid in that particular week), and over the years they’ve contradicted each other plenty of times. It’s useful for a sense of direction, not for guessing the number. Anyone who tells you on Friday “I saw it coming from the ADP” guessed right, they didn’t work it out.
The second: the jobless claims. In the week ending 25 July there were 197,000, with the four-week average at 202,750. And the week before that it was 187,000, the lowest level since 1969.
Very low numbers.
And here’s the real photograph of the American labour market right now:
they’re not firing, but they’re not hiring either.
Low claims tell you that whoever has a job is holding on to it. Weak payrolls tell you that whoever is looking for one is having a rough time finding it. The job openings data out on Tuesday backs it up: the layoff rate is stuck at 1.1%, which is very low, but the number of people quitting to change jobs is also near the bottom.
It’s a frozen labour market, not a labour market in crisis. And that’s how unemployment stays nailed to 4.2% even with hiring numbers this thin.
At least, that’s the official version. Because underneath there’s something else.
The number that really matters isn’t the headline
Last month something happened that explains why you can’t stop at the first line.
In June the unemployment rate fell, from 4.3% to 4.2%.
Good news, right?
No.
It fell because 720,000 people left the labour force. The participation rate collapsed by three tenths, to 61.5%, the lowest since March 2021 and, Covid aside, since 1976. The household survey counted 507,000 fewer people in work.
The unemployment rate is the ratio between people who are looking for work and can’t find it and the total labour force, meaning employed plus unemployed together. But to land in the unemployed group you have to have looked for work in the last four weeks. If you stop looking, you drop out of the labour force, you vanish from the count, and the rate improves.
The rate fell because people gave up. Not because they found work.
That’s why on Friday, when you see 4.2% or 4.1%, the right question isn’t “did it go up or down”. It’s why.
And if instead it climbs to 4.3% because people came back looking for work, that’s a completely different story, and far less dramatic than the headlines will make it sound.
But the number that really rules the room, with this Fed, is wages.
If hourly pay accelerates beyond 3.5%, the Fed sees fuel on the inflation fire and the September hike is back on the table. If pay slows down, the hawks lose an argument.
Look at that line before you even look at the headline. That’s what sets the tone of the afternoon.
Revisions, the favourite trap
Last trap, and the most underrated.
Every report revises the two previous months. And lately the revisions have been brutal: in the June report, April and May together were cut by 74,000 jobs.
Which means the number you traded two months ago no longer exists. It’s been rewritten.
Friday could easily print a +90,000 headline with a minus 60,000 revision to the months before. Green headline, red substance. The first move goes with the headline, the second move goes with the substance, and whoever reads only the first line ends up on the wrong side when the market turns back around.
And put this date in your diary, because it’s the big chapter of the same story: on 28 August the preliminary estimate of the annual benchmark revision comes out, the one that recalibrates the entire series. There they don’t rewrite two months, they rewrite a year.
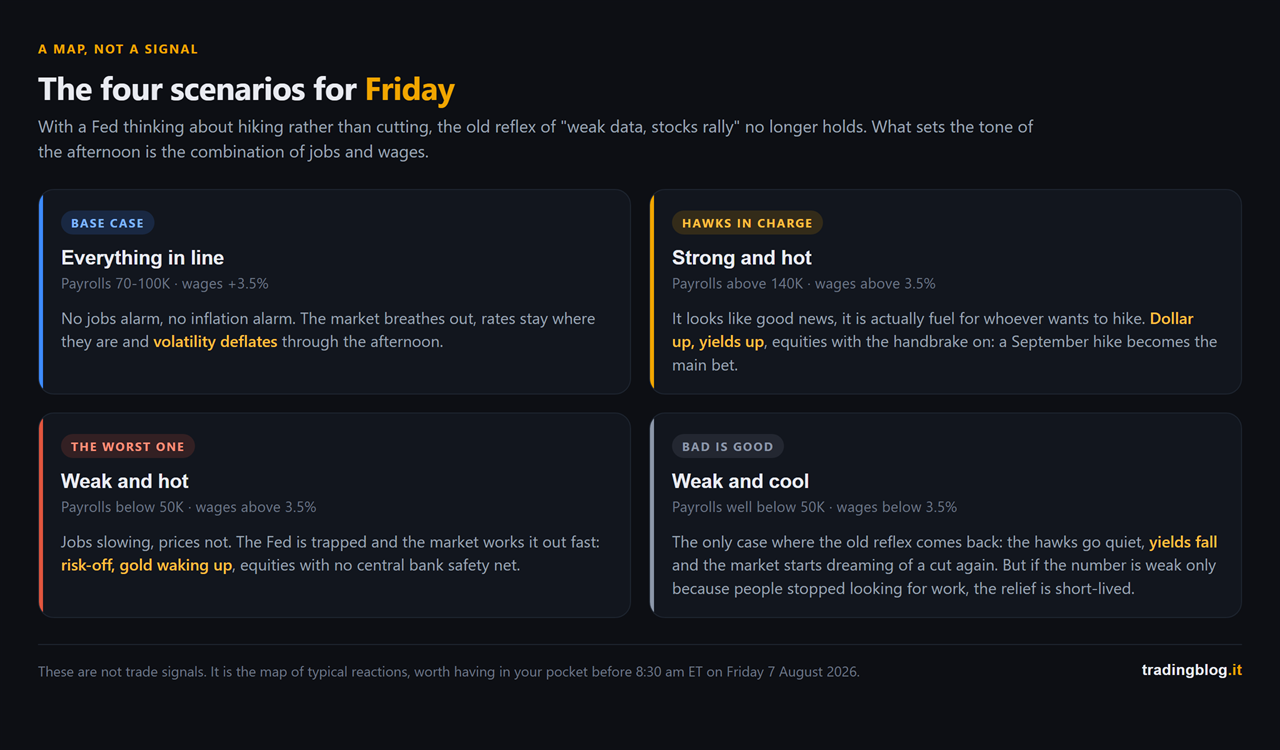
The four scenarios
I’m not giving you entry signals, obviously. I’m giving you the map, so that whatever comes out doesn’t catch you open mouthed.
Payrolls in line (70-100K) and wages at 3.5%. The most digestible scenario for equities. No panic on jobs, no inflation alarm. The market breathes out, rates stay where they are, volatility deflates through the afternoon.
Strong payrolls (above 140K) and hot wages. It looks like good news and it’s actually fuel for the hawks. Dollar up, yields up, equities with the handbrake on because a September hike becomes the main bet.
Weak payrolls (below 50K) and hot wages. The worst one. Jobs slowing and prices not. Here the Fed is trapped, and the market works it out fast: risk-off, gold waking up, equities suffering with no central bank safety net.
Very weak payrolls and cool wages. The only case where the old “bad is good” reflex comes back: the hawks go quiet, yields fall, and the market starts dreaming of a cut again. But keep an eye on participation, because if the number is weak only because people stopped looking for work, the relief doesn’t last long.
How I handle it
Not much theory, three practical things I learned by paying for them.
I don’t enter on the spike. I don’t trust the first payrolls candle. Widened spreads, slippage, prices going one way and coming back in the time it takes you to read the headline. Whoever hammers in on the first tick gets chewed up and spat out, and I say that as someone who fell for it for years with Swiss punctuality.
I cut size before, not after. And here I’m asking you a favour: if you have a position open that’s still alive on Friday afternoon, before 8:30 do the maths on what you actually lose if the stop goes with double the spread. Not by eye. With numbers. The Lot Size Calculator takes twenty seconds and tells you exactly how many lots you can afford at that stop level. Twenty seconds against the week you ruin: sounds like a fair deal to me.
I watch the second move, not the first. The market reacts to the headline first, then reads the rest (revisions, wages, participation) and makes its real decision. It’s the second move that usually holds.
And then something obvious that still separates the professionals from everyone else: these days should never surprise you. Knowing in advance that a time bomb goes off on Friday at 8:30 is half the job. The macro calendar on Thunder Desk is free, it tells you what’s coming out and how much it weighs, and it saves you from the classic scene of the trade you happened to leave open thirty seconds before the release.
Three things to take away
- The “weak data means stocks up” reflex is broken this year. Warsh’s Fed has three dissenters who want to raise rates and the market is pricing a September hike, not a cut. Weak employment with high inflation isn’t relief, it’s one more problem.
- The headline is the least informative of the three numbers. Wages, revisions and the participation rate tell you what actually happened. June is the lesson: unemployment falling while 720,000 people stop looking for work isn’t good news, it’s the opposite.
- Friday is a day for reduced size and patience. The first candle exists to fool the people in a hurry. You’re not obliged to trade it, you’re obliged to know about it.
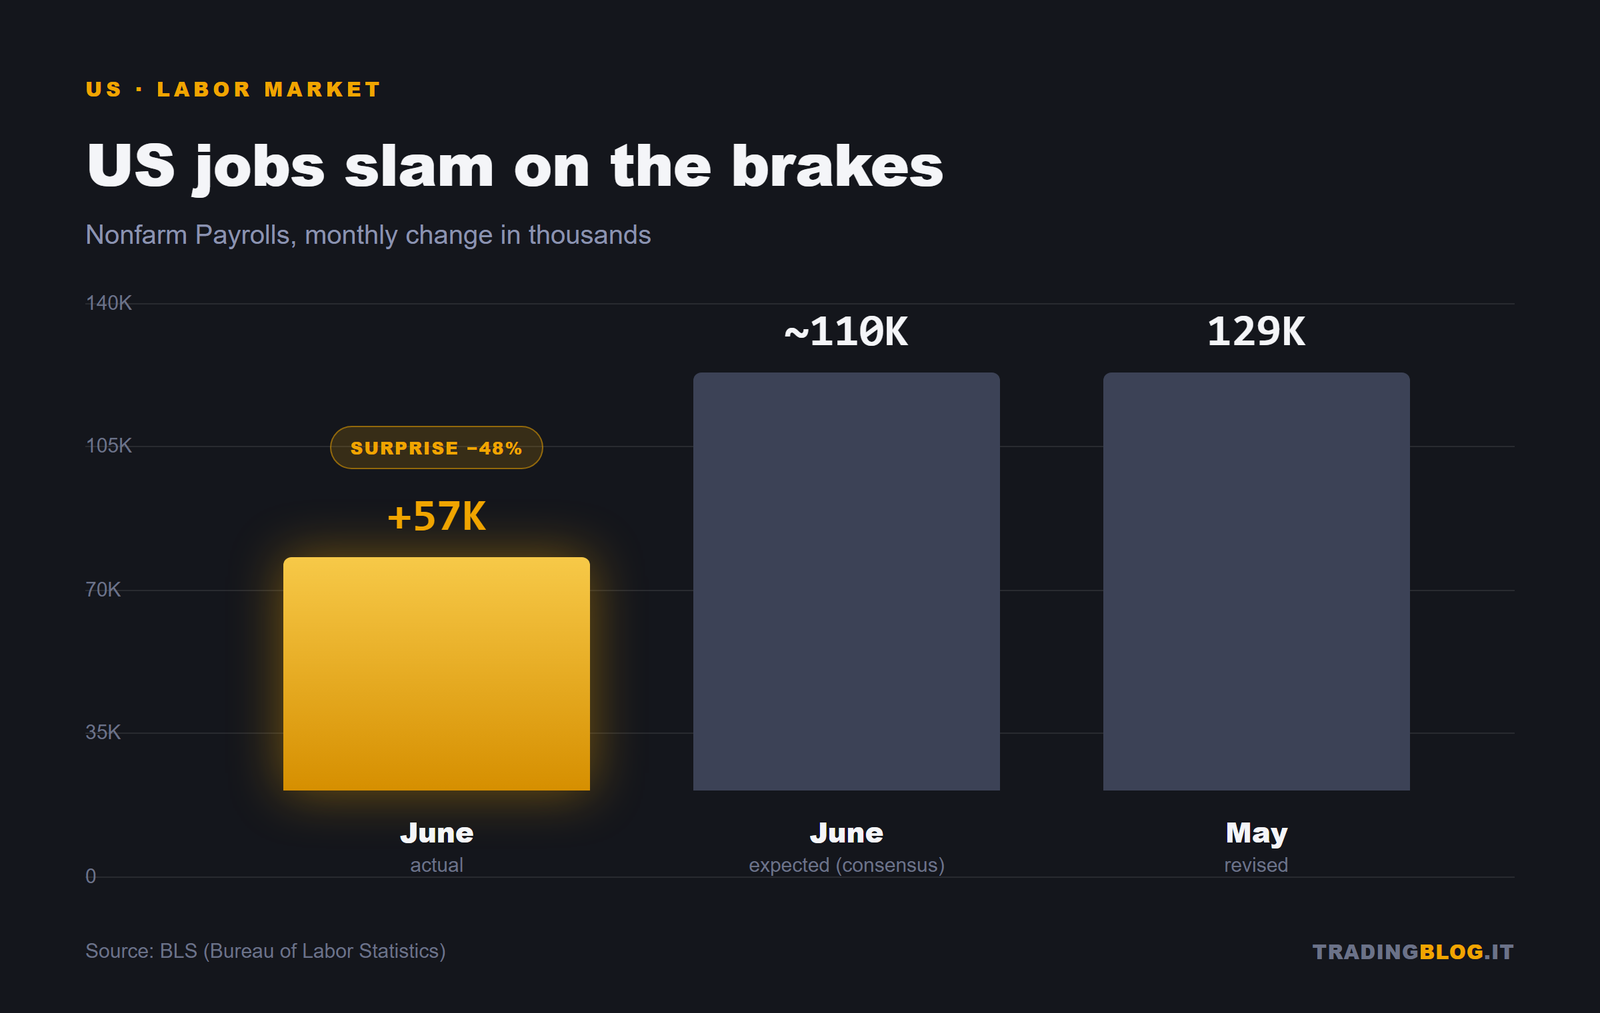
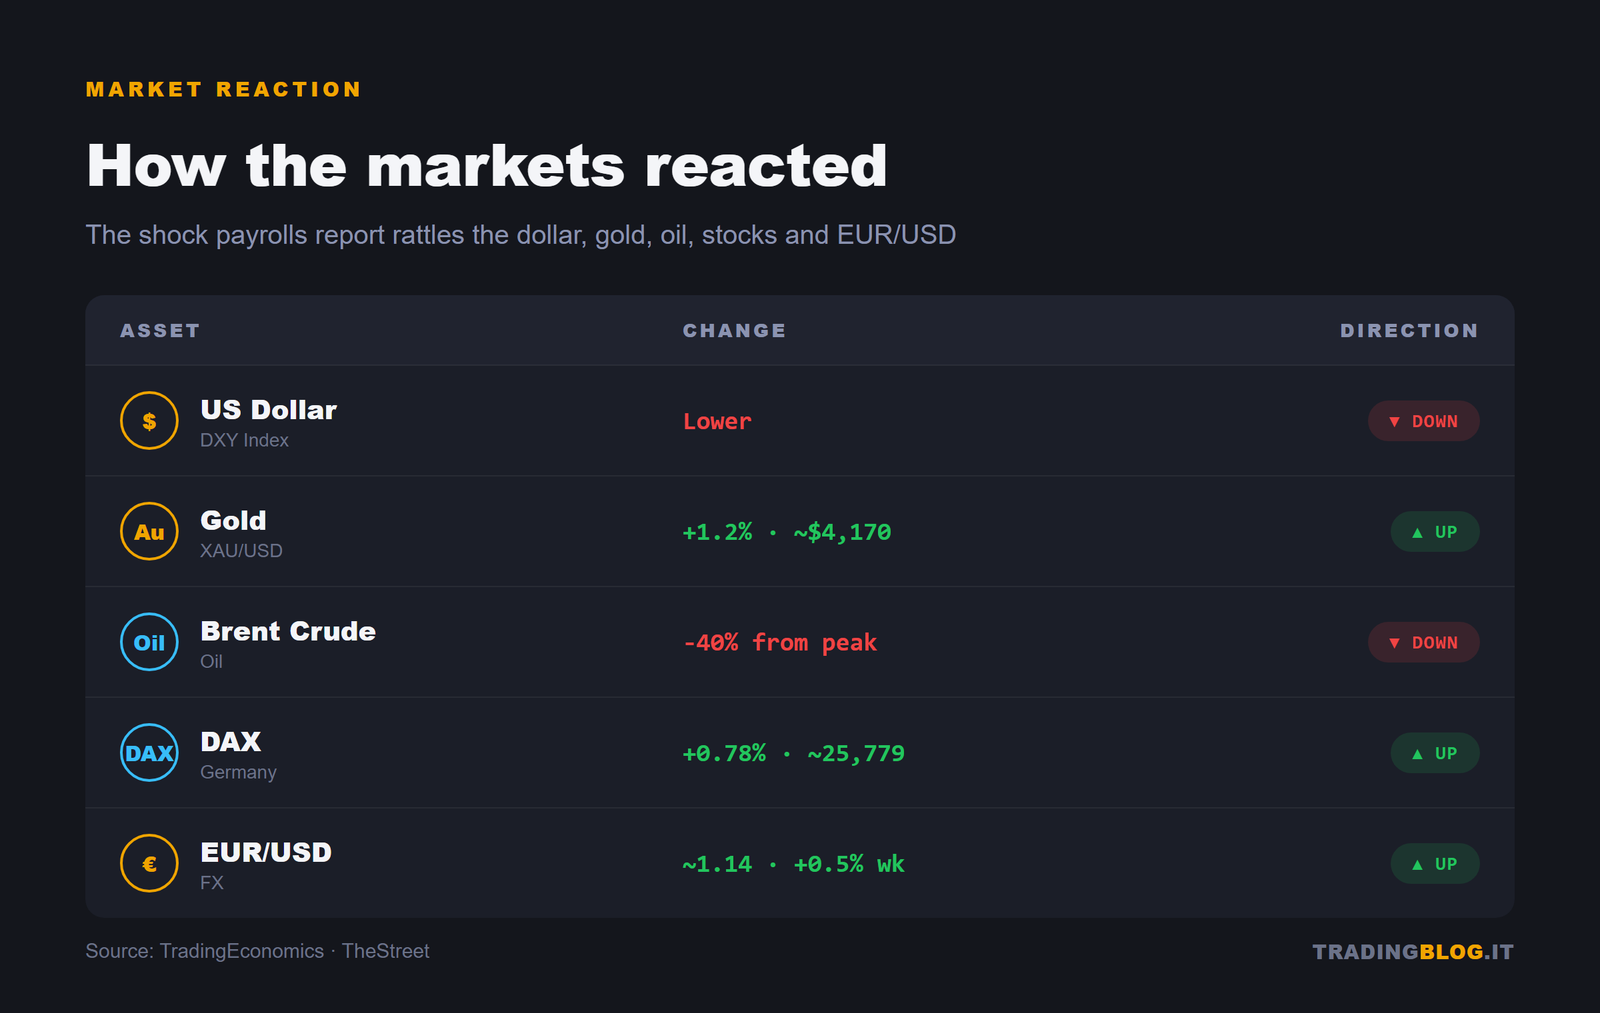
Last month the payrolls printed +57,000 and the afternoon was a rollercoaster (here’s how the intermarket moved). Those who had the map in their pocket walked through it. The others just took it.
If you want to practise sitting inside days like this without risking a single real euro, the Events on The Thunder Trader run in a demo environment on forex, CFD and crypto: you go head to head with other traders exactly when the market throws a tantrum. And if you’re starting from zero, the free ebook Win the Arena lays the method out for you.
I’ll stop here. On Friday, before you press any button, ask yourself the right question: not “what’s the number”, but “what is the market already pricing in, and what happens if the number says the opposite”.
The rest is noise.
Suerte Amigo!
Tiziano Brunno
Tradingblog
Disclaimer: purely informational and educational content. It does not constitute financial advice nor an invitation to trade. Trading carries the risk of capital loss.