Absorption, exhaustion, imbalances: how you pick the price of your order

Hi trader,
there is a precise moment when trading stops being a quiz and becomes a craft.
It is when you stop asking yourself “is it going up or down?” and start asking “what price do I put my order at, and where do I pull it if I got it wrong?”.
The first one is a bar-room question. The second one forces you to pick a number, and a number you can either defend or you can’t.
In the previous episode we opened the candle up: volume at every price, who was aggressive, the delta. That was the view.
Today we close the series from the other side, the one that matters: how you read a level, and above all why the level sits right there and not two points further along.
At the end I’ll show you two screens of mine, real ones, from two different days.
Absorption: all that effort, no result
Start here, it is the most important concept in the whole series.
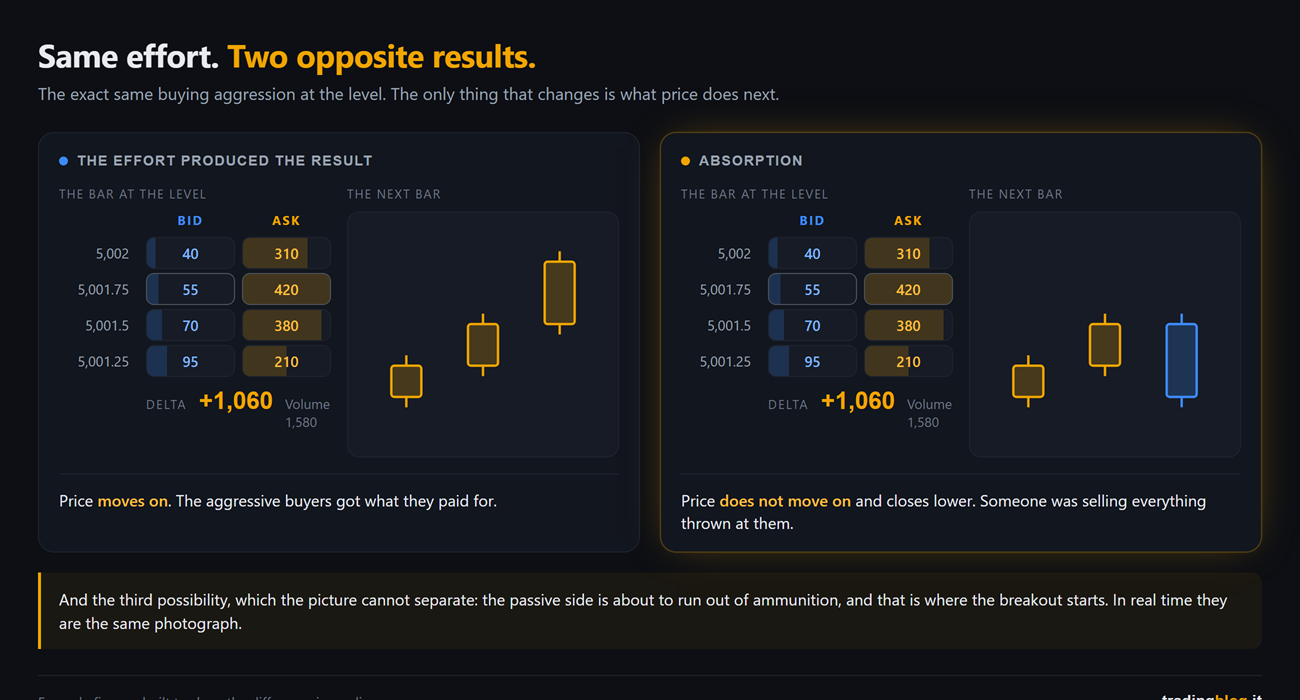
Absorption means that a mountain of aggressive volume hits one price from one side, and price does not move on in that direction.
On the footprint you see it like this: one or two cells with numbers off the scale compared to their neighbours, concentrated on a handful of levels, and the bar that does not extend beyond. Often it even closes on the opposite side.
Remember the rule from episode 1? If a cell prints 800 at the ask, it means there were 800 contracts sitting there passively for sale at that price, and somebody took the lot while paying for the hurry.
Now flip that sentence around.
If price did not rise after those 800, that passive seller won the exchange. They sold everything thrown at them and kept restocking the counter as fast as it was bought.
It is the scooter being pushed uphill we talked about. You push like mad, you don’t move: the problem is not the push, it is the weight on the other side.
And now the uncomfortable part
That picture has a third possibility it cannot tell apart.
Huge volume and price standing still can mean two opposite things:
a large passive side that is holding, and price turns;
or a large passive side that is about to run out of ammunition, and that is where the breakout starts.
They are the same image. Identical. There is no threshold, colour or indicator that separates them in real time, and anyone telling you otherwise is selling you something.
Absorption and exhaustion can only be recognised with certainty after the fact.
That is not bad news, it is the most useful thing in this piece, because it tells you where the information actually is: not inside the cell, in what price does immediately after.
Huge volume and price standing still is a question, not an answer.
The answer comes from the bars that follow. If price turns, that passive side held and the level worked. If instead the level gets crossed with volume behind it, that passive side had run out, and what you were looking at was not a wall but the start of a move.
That is why the event on its own is worth nothing and the reaction to the event is worth everything. It is the same reason a big isolated cell tells you nothing, while the same cell followed by three bars that cannot get past it tells you plenty.
Exhaustion: the move continues, the fuel does not
Exhaustion is another thing entirely and has to be kept separate, because the two get mixed up constantly.
In absorption there is a lot of aggression producing no movement. In exhaustion there is little aggression still producing movement.
The first is a wall. The second is fuel running out.
On the footprint you recognise it by the cells thinning out as price gets closer to the extreme. The first bars of the push have numbers of 300, 400 contracts. The last ones have 20, 30. Delta stays positive, but it is a thinner and thinner positive.
Price is still rising, but it is doing it with almost nobody left.
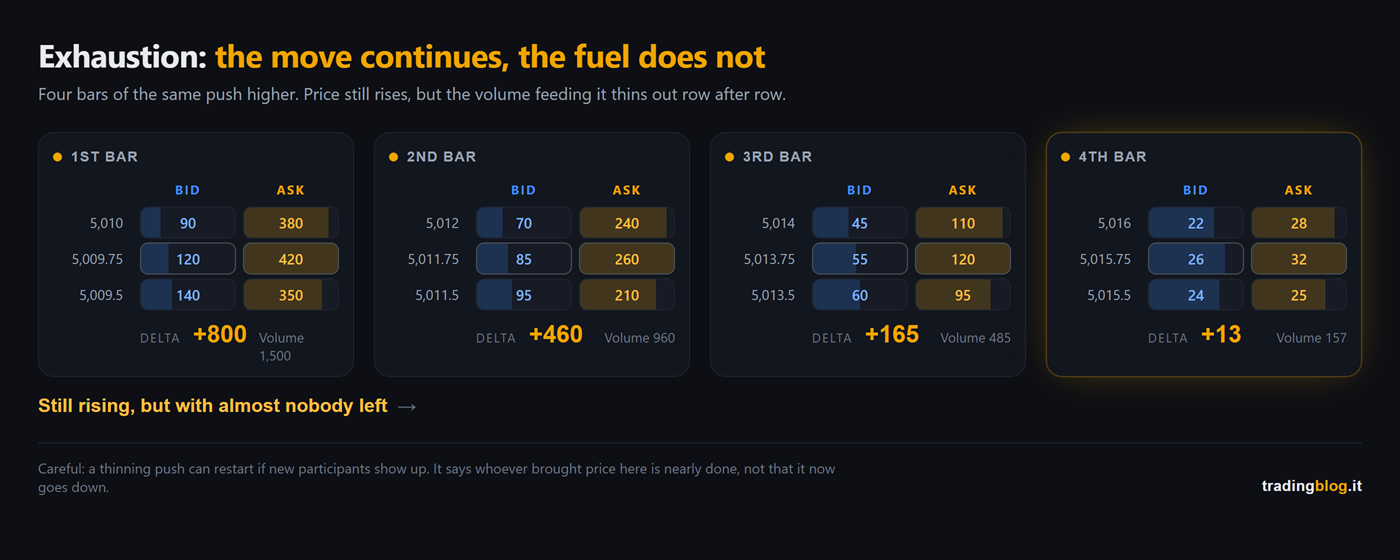
Careful here too: a thinning push can restart a minute later if new people show up. It is telling you that whoever brought price this far is nearly done, not that it now goes down.
Imbalances, and why you read them diagonally
An imbalance is a cell where one side beats the other by a mile.
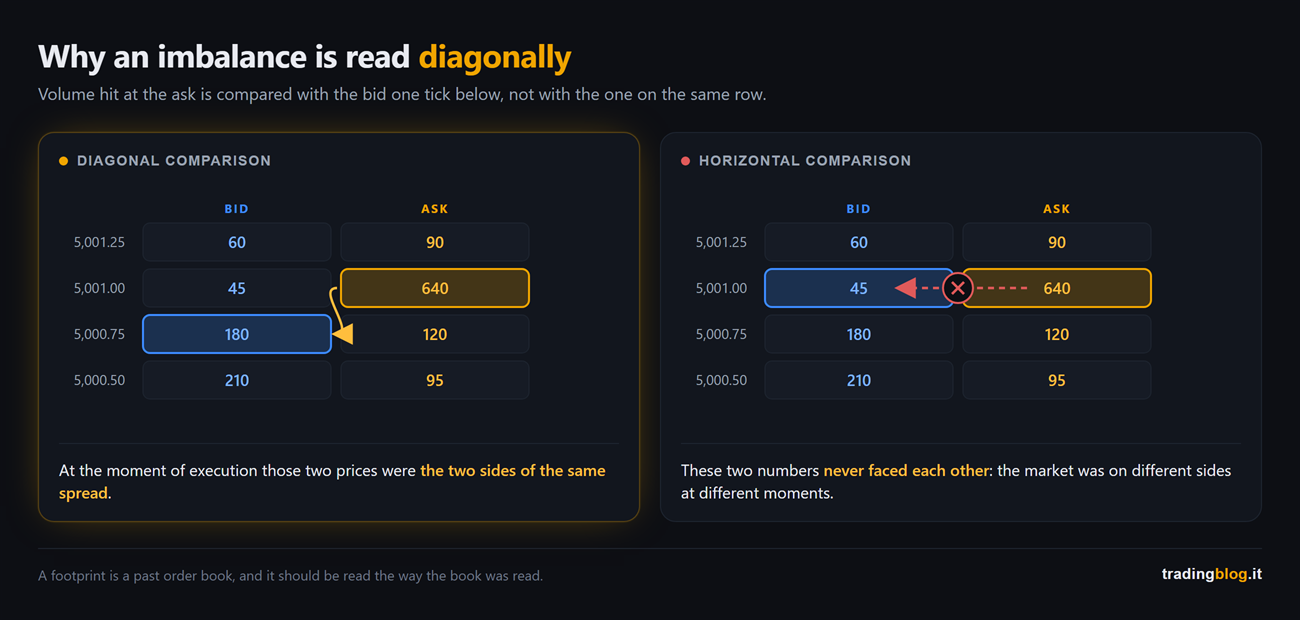
Easy so far. The point almost nobody explains is that the comparison is NOT horizontal.
The ask at a given price is compared with the bid one tick below. Diagonally.
The reason is a good one, and it is the reason this stuff makes sense at all. At the moment those two trades happened, those two prices were the two sides of the same spread: best bid and best ask are one tick apart. Whoever was buying aggressively up there, the seller who could have countered them was the one waiting one tick below.
Comparing the two numbers on the same row instead compares two different moments, when the market was on two different sides. Two teams that played on different days.
The diagonal comparison puts back on the pitch the ones who actually faced each other.
The threshold is not a law of nature
When a cell beats its diagonal counterpart by a lot, the platform colours it for you. How much “a lot” is, you decide.
No exchange defines it. There is no standard, and the platforms do not agree with each other.
On Sierra Chart, which I used for years, the thresholds are yours: you set them as a percentage or as absolute volume, across several colour bands.
On DeepCharts by Volumetrica, which is what I use now, the threshold is changed in the footprint candle parameters.
Two lines of transparency, which feel owed: that above is an affiliate link. If you use it and subscribe I earn a commission, and you don’t pay a cent more.
The value that circulates most as a default is three times the opposite side, but that is common practice, not law.
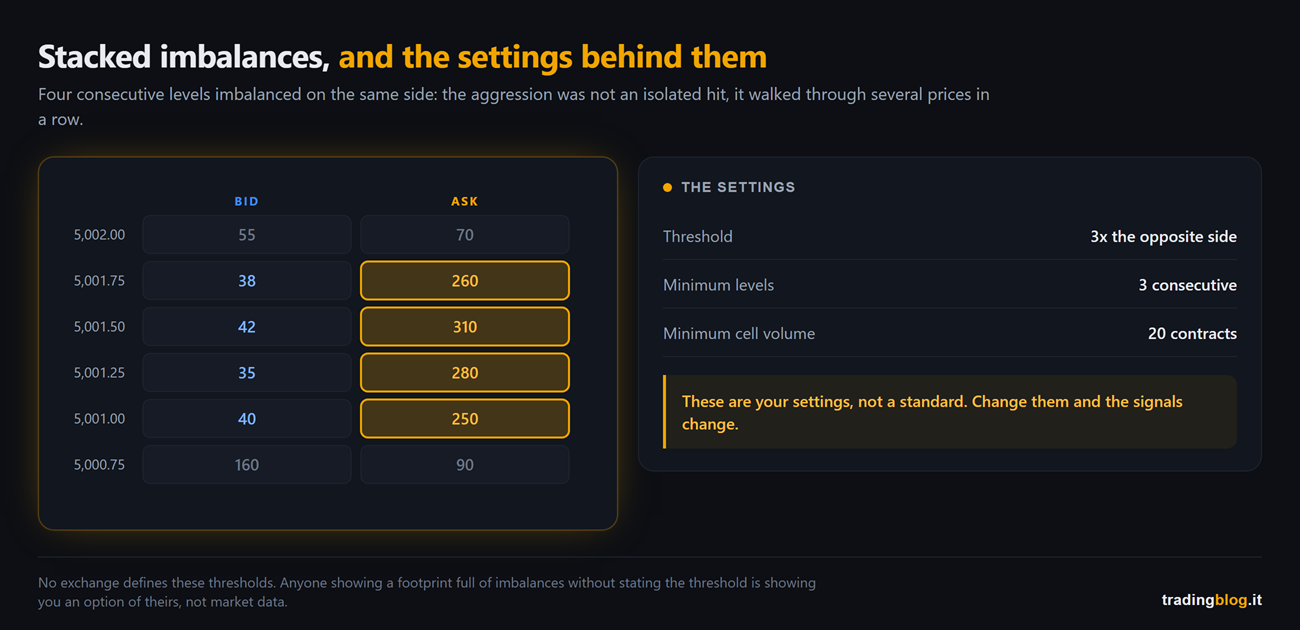
And the consequence is heavy: change that number and the signals on your screen change. Anyone showing you a footprint full of imbalances without telling you the threshold it is set to is showing you an option of theirs, not market data.
Then there is the filter almost everybody forgets to switch on: a minimum volume for the cell to count. Without it, 3 against 1 is a 300% imbalance and means nothing. There is even a setting that decides whether a level with zero contracts on one side should count as an imbalance: with that on, 40 against 0 becomes an infinite imbalance, and half your chart lights up.
When instead you find three or four consecutive levels imbalanced on the same side, stacked imbalances, that is a more solid trace: it means the aggression was not an isolated hit, it walked through several prices in a row.
Delta that does not follow
Last tool, and the most abused in the business.
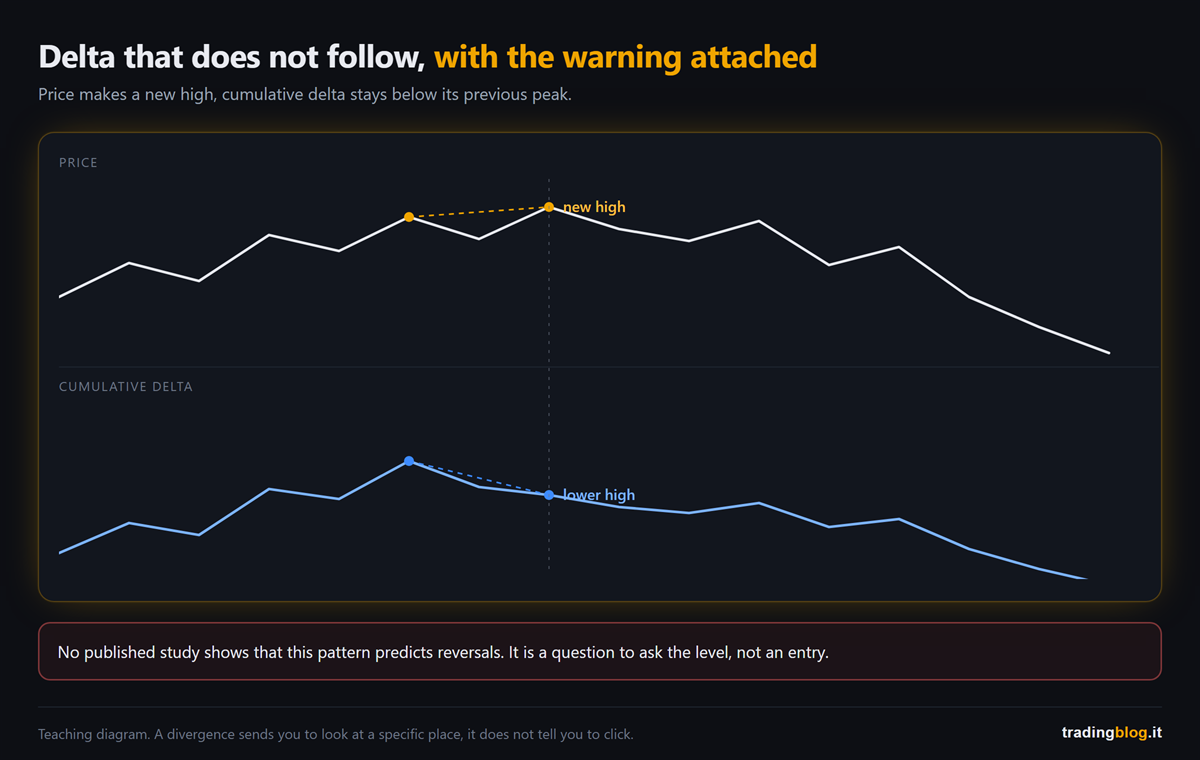
Price makes a new high, cumulative delta does not: it stays below its previous peak. It is called divergence, and online it is sold as the signal that gets you the tops.
It is not.
No published study shows that this pattern predicts reversals. I am writing it here because this is where I lose a few readers, but I would rather lose them now than watch them go short on a divergence.
What a divergence does, and does well, is send you to look at a specific place.
And there is a second reason never to read delta on its own: the same imbalance moves prices differently depending on how much liquidity it finds in front of it. On a thick book it moves price by a few ticks, on a thin book by far more. Microstructure has measured it: for the same flow, the impact grows the thinner the wall is.
Delta is not read on its own. It is read divided by how thick that wall was.
The three outcomes of a level
Let’s put it all on the table. When price arrives at a level you marked, there are three possible endings in front of you, not two.
Rejected. It arrives, finds people ready on the other side, the aggression fades as it climbs, the cells thin out, price turns. That is the scenario you had in mind.
Eaten. It arrives, finds people ready, and eats the lot: stacked imbalances going straight through the level, and price coming out the other side with volume behind it. The level was not a wall, it was a door.
False move. It arrives, pokes through slightly, the volume beyond the level is laughable and price comes straight back. Someone pushed just enough to go and collect the orders sitting there.
The footprint does not tell you which of the three it will be. It tells you which of the three just happened, while to the naked eye they all looked the same.
And now the real question, the one holding up everything else.
Why the level sits right there
Let me show you a screen of mine from August 4 on the S&P. There is no order, there is no position. It is a demonstration, and it is the thing that convinced me more than a thousand explanations.
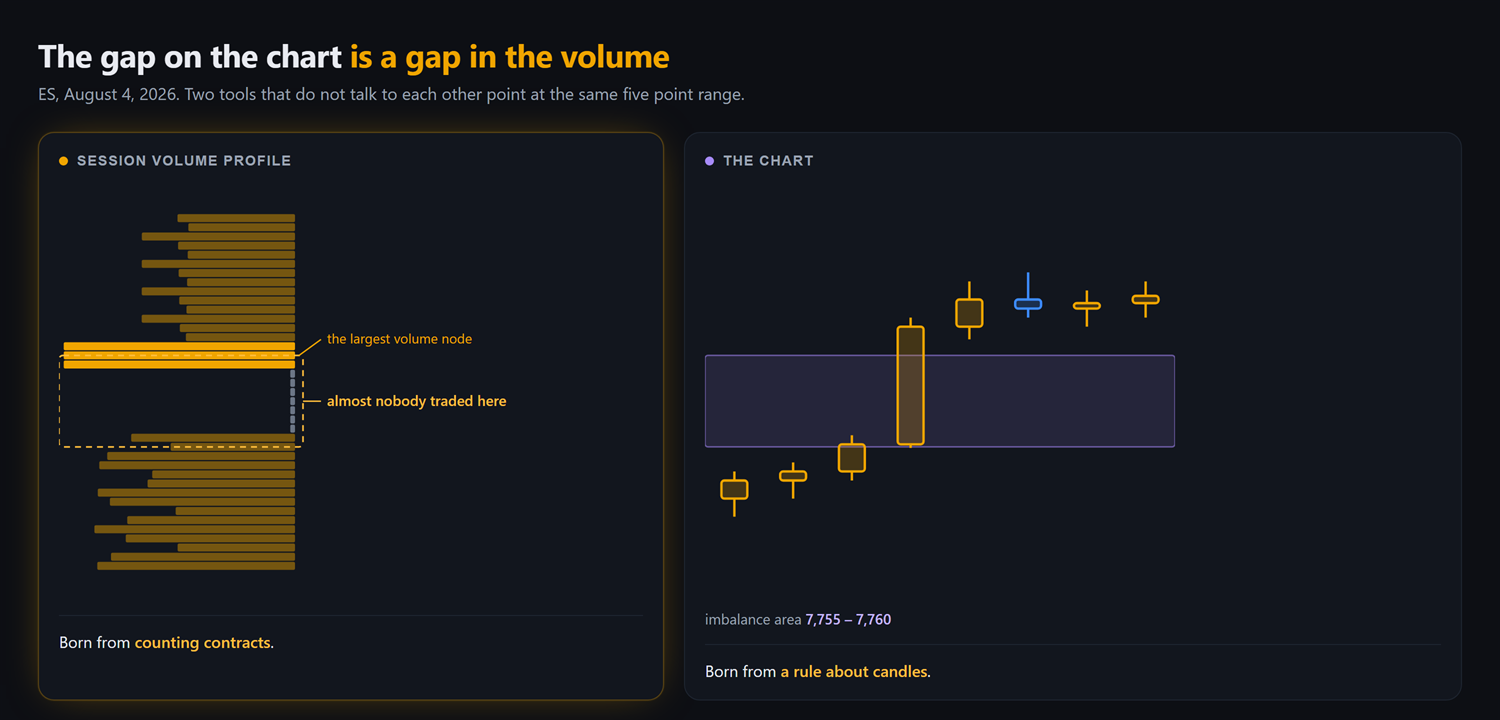
On the right the chart, with a purple box drawn by the most trivial rule there is: three candles, price runs, and between the first and the third a gap is left that nobody covered. In English they call it a fair value gap, in Italian an unfilled imbalance. That box sat between 7,755 and 7,760.
On the left, on the same price scale, the session volume profile. That is, how many contracts went through at every single price.
And in there, between roughly 7,755.6 and 7,759.4, the profile is not there. A hollow notch. Above it, right above the box, the biggest volume node of the day. Below, the profile starting to fill in again.
Stop a second on what that means.
The box comes from a rule about candles. The void comes from counting contracts. Neither knows the other exists. They are two independent measurements of the same five point range.
They are not two clues that agree. They are the same thing with two different names.
And this is where the gap on the chart stops being a fashionable drawing and becomes something you can defend: almost nobody traded in there. There is no merchandise resting, nothing to slow price down. Price ran through and did not stop to do business.
Everything else follows naturally.
Price runs back through it fast, because it meets no obstacles. And the point that offers the least resistance of all is the centre of the void, where the profile is thinnest.
That is why those bands deserve a mark on the chart, while a thousand other lines drawn by eye do not.
A real case: ES, August 7
Now the same thing with a trade in it. I’ll spare you the details of how it is built, that is not today’s point.
August 7, S&P 500, early afternoon.
Price had risen, then started to pull back. Inside the pullback there was an empty area like the one before, and that is where my level was, on the buy side.
And I’ll tell you what I am not telling you as well, so we are even.
It was not only the void in the profile landing on that price. Two other things landed on top of it, my own stuff, measured over years on my markets, and that is the reason the order ended up exactly there and not one point lower.
I can’t put that part in a free article, and not because it is a secret. Because pulled out of the reasoning around it, it becomes yet another little rule to copy, and copied little rules last three stops.
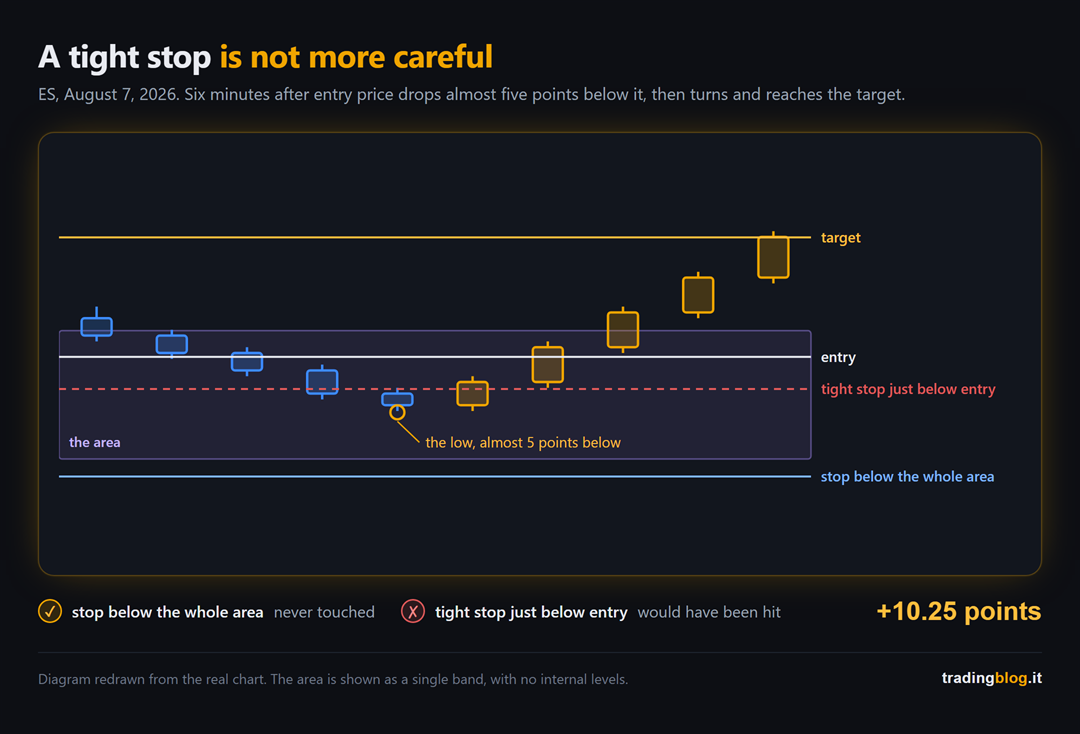
Order at the level. Stop below the whole area, not just below the entry: if price had eaten that entire band, the reading was wrong and the trade had no reason left to exist. Target at the first obstacle above.
Outcome: filled, target taken, +10.25 points in about twenty minutes. After the exit price went a bit higher still, and that is fine: the target sat on the obstacle, not on my wishes.
So far it is a trade like many others. The useful part is somewhere else.
Price went under before it worked
Six minutes after getting in, price dropped almost five points below me. It made its low there, and only then turned back up.
Look at what that means, because it is the most useful thing in the whole piece.
With the stop where it was, that low did not even come close: there was margin left.
With a “tight and clever” stop resting just below the entry, that trade would have been a loss. The exact same trade that made +10.25.
A tight stop is not a more careful trade. It is the same trade with a higher chance of losing.
And if that distance is too much for your account, the answer is not to tighten the stop: it is to reduce the size, or to let that trade go. On futures there is then a second ceiling, the broker’s margin, which cuts your size even when risk would say yes. If you want to run both calculations together in ten seconds I have just put the futures position size calculator online, it is free and it also tells you when it is worth switching to the micros.
What you do from tomorrow morning
Same as episode 1, the homework is small and for a week you do not trade on this.
Take a future you follow, turn on the session volume profile and hunt for the gaps: the bands where the profile thins out until it disappears. Mark the centre, which is the poorest point.
Then wait for price to come back to it, and write down a single word: rejected, eaten, or false move.
No orders. Just the word.
After twenty levels you will have something no course can give you, namely how many of your levels actually hold and how many were decoration. If you don’t have a place to keep the notes, use the TradingBlog Diary, it is free.
And I’ll close the promise I left open last week: the twin order on ES on July 29 was never filled, price reached the level, turned there and left without me. The reason fits in one line: a limit order does not get filled because price touches your price, it gets filled if somebody trades through it in enough quantity to clear the queue in front of you. It happens, and it will happen to you too.
You don’t pick a level with a ruler. You pick it where two different things tell you the same price.
With this we close the order flow series.
And I’ll leave you with the thing that taught me the most across these two pieces, which is not a pattern and not a tool either.
The gap on the chart and the gap in the volume are the same thing. The wall on the book and the cells fading out are the same thing. When two tools that do not talk to each other give you the same number, that number stops being your opinion.
That is where you stop guessing.
If this was useful, send it to that friend of yours who draws purple boxes everywhere without ever checking whether there is a void underneath. You’d be doing them a favour.
Suerte Amigo!
Tiziano Brunno
Tradingblog
Want to put your market reading to the test?
Compete and challenge other traders inside an Arena in a demo environment, with no real capital at risk. Discover the Performance Arena Events by The Thunder Trader.
Disclaimer: purely informational and educational content. It does not constitute financial advice or an invitation to trade. Trading involves the risk of capital loss.