Posts

Red liquidation cascade: 253 million in leveraged positions closed by force

Leverage and liquidations: how you get wiped out

Hey trader,

let me tell you how you burn 253 million dollars in a single day.

You don’t need an epic crash, a bad headline is enough. Middle East tensions came back, crypto went down with the rest of the risk-off, and in a few hours 253 million dollars of leveraged positions were wiped out.

The real question isn’t “why did it drop”. It’s: why did so many people blow up all at once? The answer has a name, and it’s leverage.

Leverage, explained without the jargon

Let me keep it simple. Leverage is a loan the exchange gives you to trade with more money than you have. You put in 100, with 10x leverage you move 1,000. If it goes up, you earn as if you had 1,000. Nice, right?

Hold the celebration. Leverage cuts both ways. If the market goes against you even a little, you have to cover that loan. And if your margin isn’t enough anymore, the exchange doesn’t call you and doesn’t apologize: it closes your trade for you. That’s liquidation. With 10x leverage a 10% move against you is enough, actually a touch less because the exchange closes a moment earlier to protect itself, and you’re out. With 50x leverage, do the math yourself.

The avalanche: why everyone blows up together

Here’s the part almost nobody explains. When the first wave of liquidations hits, those are forced sales. And forced sales push the price even lower. A moment later the second wave hits, pushing it down again. And so on.

It’s called a liquidation cascade, an avalanche. It’s not the market that “decided” to crash. It’s thousands of leveraged trades dragging each other down the cliff. Those 253 million are the value of the positions closed by force, not money burned one to one, but the mechanism is exactly that. And mind you, that wasn’t even one of the really bad days: in real crashes we’re talking billions. Picture the landslide.

How not to end up on the list

Little theory and a lot of practice. I won’t tell you “don’t use leverage”, you wouldn’t listen anyway. I’ll tell you how not to get wiped out:

  • Keep your leverage low. The difference between 3x and 50x isn’t “more courage”, it’s how close you’re walking to the edge of the cliff.
  • Size the position on the risk, not on the dream. First you decide how much you’re willing to lose, then you calculate the size. Never the other way around.
  • Always set your stop. Your own stop, decided with a cool head, beats the liquidation decided by the exchange.
  • Don’t enter with leverage before a big piece of news. The Middle East doesn’t send a warning.

Leverage doesn’t make you a better trader, it only makes you faster, for better and for worse. And if you don’t yet have a method that works without leverage, leverage only gets you to the wall sooner.

The difference between who blows up and who stays standing

Back to those 253 million, because there’s a twist. A good chunk of those people didn’t get liquidated because of a bad analysis, they got liquidated because they walked in blind. They didn’t know geopolitical tension was in the air, they didn’t know where the big positioning sat, they didn’t know the zones where price usually reacts.

Here’s the point: the line between who gets wiped out and who takes the day home almost always runs right there, through how much you see before you enter. The problem is that this data is scattered across twenty different places, often behind a paywall and in insider jargon.

That’s why we built Thunder Desk, and I’ll say it straight: if you trade with leverage and you don’t have a tool like this in front of you, you’re driving down the highway with your eyes closed. In one place, free, you’ll find the macro calendar with the real impact of every event (so you see the next bad headline coming), the positioning of commercials and speculators from the COT reports, gamma exposure on the S&P and Nasdaq, and the zones of interest on the DAX, ES, NQ and Dow. No noise, just data.

Create your account, open it five minutes before you trade, and the difference between you and those 253 million, you make it right there.

Stop trading blind

Macro calendar, COT, gamma exposure and zones of interest on the DAX, ES, NQ and Dow. Free, in one place. No noise, just data.

Open Thunder Desk →

When you combine ignorance and leverage, you get some pretty interesting results. Warren Buffett

That’s it from me. If you know someone playing with fire at 50x leverage, send them this article: you might save them the funeral of their account.

Suerte Amigo!
Tiziano Brunno Tradingblog

Want to put your market reading to the test?

Compete and challenge other traders inside an Arena in a demo environment, with no real capital at risk. Discover the Performance Arena Events by The Thunder Trader.

Discover The Thunder Trader →

Disclaimer: purely informational and educational content. It does not constitute financial advice or an invitation to trade. Trading involves the risk of capital loss.

TradingBlog Diary dashboard: equity curve and emotional thermometer on a dark amber theme

Trading journal: without one, you’re trading blind

Your memory is lying to you. Ask a trader how the month went and the answer comes from feeling: “bad”, “so-so”, “I recovered near the end”. Almost always it is a softened, or dramatized, version of what actually happened. The brain remembers the two trades that hurt and forgets the twenty ordinary ones, and it makes the next decisions on that distorted memory.

The only antidote is to write it down. Not in words, in numbers and in states of mind. That is journaling, and it is the difference between traders who improve and traders who go in circles for years.

What a trading journal really is

A trading journal is not the profit and loss list your broker already gives you. It is the full account of every trade: when you entered and why, where your stop was, how much you were risking, what was going through your head at that moment and how it ended. With enough rows, you stop trading on feeling and start seeing patterns.

That is where the uncomfortable truths surface. That most of your losses come from a single instrument. That your best trades are the ones where you waited, and the worst are the ones where you jumped in off-plan. That the setup you “really like” has actually been losing money for months. You do not see any of this from memory, you see it only if you wrote it down.

The part everyone skips: the emotional journal

The market does not ruin you with technical analysis, it ruins you with your head. Yet almost no one keeps track of how they felt while trading, and that is a huge mistake, because the emotion you enter a trade with predicts the outcome better than almost any indicator.

Logging the mood of every trade, calm, anxious, euphoric, under pressure, and crossing it with the result, surfaces the most useful truth a trader can have about themselves: when you actually make money and when you are only hurting yourself. You might discover that your trades taken in a state of euphoria, right after a win, are systematically in the red. From that moment you hold a rule, not a hunch.

Stop repeating the same mistakes

A mistake you recognize while rereading it in black and white, next time you see it coming. The journal turns errors from recurring taxes into lessons paid once. Without it, you repeat the exact same mistake every two weeks, convinced each time that “this time is different”.

Know what to do in advance, and what you are really worth

With a complete journal you stop wondering whether a strategy works and start knowing. You see your real win rate, your average risk reward ratio, your expectancy, your best instrument and the one draining your account. It is no longer opinion, it is the precise pulse of your potential and your limits. And when you know the numbers, you know in advance what to do: what to push, what to cut, when to stop.

Start today, free, with TradingBlog Diary

Knowing you need a journal and not keeping one is the classic good intention. That is why we built TradingBlog Diary, the trading journal that does all the boring work for you.

You can log a single trade, or enter a whole session or a full day in one go. And if you already keep everything in your broker’s file, you import it directly, from CSV or Excel, with nothing to retype by hand. From there it takes over: TradingBlog Diary gives you back your equity curve, your win versus loss distribution, per-instrument performance and the emotional thermometer that links each state of mind to its real result. Whenever you want, you export everything and the data stays yours.

Nothing to install and nothing to pay: you create a free account and your journal stays saved to your profile, ready every time you open it, from any device. Sign up, enter your next trade and start seeing your trading the way it really is, not the way you remember it.

Start your journal today, free

Log your trades, import your history from your broker and discover your emotional thermometer with TradingBlog Diary.

Open TradingBlog Diary →

If you want to understand why numbers beat feelings, read also Win Rate: the number that is lying to you, and for the emotional side Revenge trading: how to stop the tilt.

Without data, you’re just another person with an opinion. W. Edwards Deming

Want to put your market reading to the test?

Compete and challenge other traders inside an Arena in a demo environment, with no real capital at risk. Discover the Performance Arena Events by The Thunder Trader.

Discover The Thunder Trader →

Disclaimer: purely informational and educational content. It does not constitute financial advice or an invitation to trade. Trading involves the risk of capital loss.

Win Rate: The Number That Is Lying to You

🤓 Nerd Mode

If I told you that your favorite trader on Instagram, the one flaunting a 90% win rate, could be losing money every single month, would you believe me? You should. Because the win rate, the percentage of trades closed in profit, is the most overrated and most misunderstood number in all of trading.

It is the number that makes you feel good while your account bleeds out. In this article I will explain why it is lying to you, and which number actually counts.

The win rate, on its own, tells you nothing

Picture two traders. The first wins 9 trades out of 10, but when he loses, he loses big. The second wins only 4 times out of 10, but when he wins he takes home twice what he risked. Who makes money?

It might surprise you, but it can easily be the second one. Because the win rate tells you how often you are right, not how much you make when you are right and how much you lose when you are wrong. And it is those two things together that decide whether you are in profit or in the red.

A 90% win rate with losses that wipe out ten winners is a machine for losing money in style. A 40% win rate with a good risk/reward ratio is a profitable system.

🧩 Explained Simply: expectancy

The number that really counts is called expectancy: how much you expect to make, on average, on each trade. The formula is simple:

Expectancy = (Win rate × Average win) − (Loss rate × Average loss)

If the result is positive, you make money over the long run. If it is negative, you lose, no matter how high your win rate is. Expectancy combines the two things the win rate ignores: how much you win and how much you lose.

Two systems, same profit, opposite win rates

Let’s take 10 trades, always risking 100 dollars per trade. Look at what happens with two different approaches:

System Win rate R:R Result over 10 trades
A 60% 1:1 6×100 − 4×100 = +200
B 40% 1:2 4×200 − 6×100 = +200

The exact same profit. But system B gets there while being right less than half the time. This changes everything on the mental side: if you do not need to guess much, you are far less exposed to frustration, revenge trading and the urge to force trades. A good risk/reward ratio buys you patience.

The minimum win rate you actually need

The good news is that, once you know your risk/reward ratio, you can instantly work out the minimum win rate you need just to break even. The formula is:

Minimum win rate = 1 / (1 + R:R)

Here is what it means in practice:

If your R:R is You only need a win rate of
1:1 50%
1:2 33%
1:3 25%

With a 1:3 ratio you only need to be right a little more than once in four to be in profit (exactly one in four already puts you at break-even, before spread and commissions). This is why experienced traders are obsessed with risk/reward and not with the win rate: they hunt for the few trades that offer a favorable ratio, and skip the rest.

What to do about it, in practice

Three concrete moves, right now:

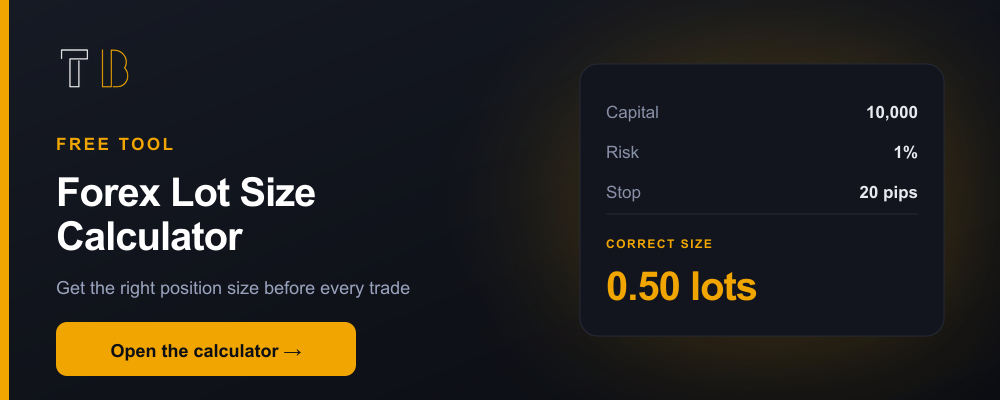
1. Calculate your size before every trade. Expectancy only works if the risk per trade is constant. Before you enter, calculate the correct lot size based on capital, risk percentage and stop distance.

Open the Forex Lot Size Calculator

2. Track everything. You cannot improve what you do not measure. Log every trade, your real win rate, your average R:R and your expectancy. The TradingBlog Diary works them out automatically, complete with equity curve and Monte Carlo simulation.

3. Go deeper on money management. The win rate is just one piece of the puzzle. If you want the full picture, read Money Management Like a True Professional.

It is not whether you are right or wrong that is important, but how much money you make when you are right and how much you lose when you are wrong. George Soros

Want to put your market reading to the test?

Compete and challenge other traders inside an Arena in a demo environment, with no real capital at risk. Discover the Performance Arena Events by The Thunder Trader.

Discover The Thunder Trader →

Trader nel vortice rosso del tilt con una mano sul pulsante STOP

Revenge Trading: Why the Brain Falls for It

June 2026 was a mean month. Bitcoin left about 20% on the table, markets got jittery over a weak NFP, and plenty of accounts found themselves in the red without having done anything spectacularly wrong.

And it’s right there, with the screen full of negative numbers, that the most dangerous thought of all kicks in: “now I’ll jump back in and get my money back.” Welcome to revenge trading.

What revenge trading is

Revenge trading is the attempt to recover a loss by quickly opening new positions, driven by anger rather than a market idea.

It’s not a strategy. It’s an emotional reaction dressed up as trading. The logic isn’t “there’s a valid setup here,” but “the market took my money and I’m taking it back, now.”

The problem is that the market doesn’t even know you exist. It isn’t punishing you and it owes you nothing. But your brain, in that moment, is convinced otherwise.

Why the brain falls for it

This has nothing to do with low intelligence. It has to do with how we’re wired.

Loss aversion. Numerous behavioral studies show that the pain of losing weighs about twice as much as the pleasure of gaining the same amount. Losing €200 burns like gaining €400. This imbalance pushes you to do irrational things just to erase that pain.

Tilt. It’s the term borrowed from poker: a state in which emotion has hijacked your decisions. On tilt you see opportunities everywhere, ignore your plan, and mistake agitation for clarity.

Payback FOMO. After a loss, the fear of “falling behind” amplifies. Every candle that moves without you looks like the train you’re missing, and you throw yourself in just to not stand still.

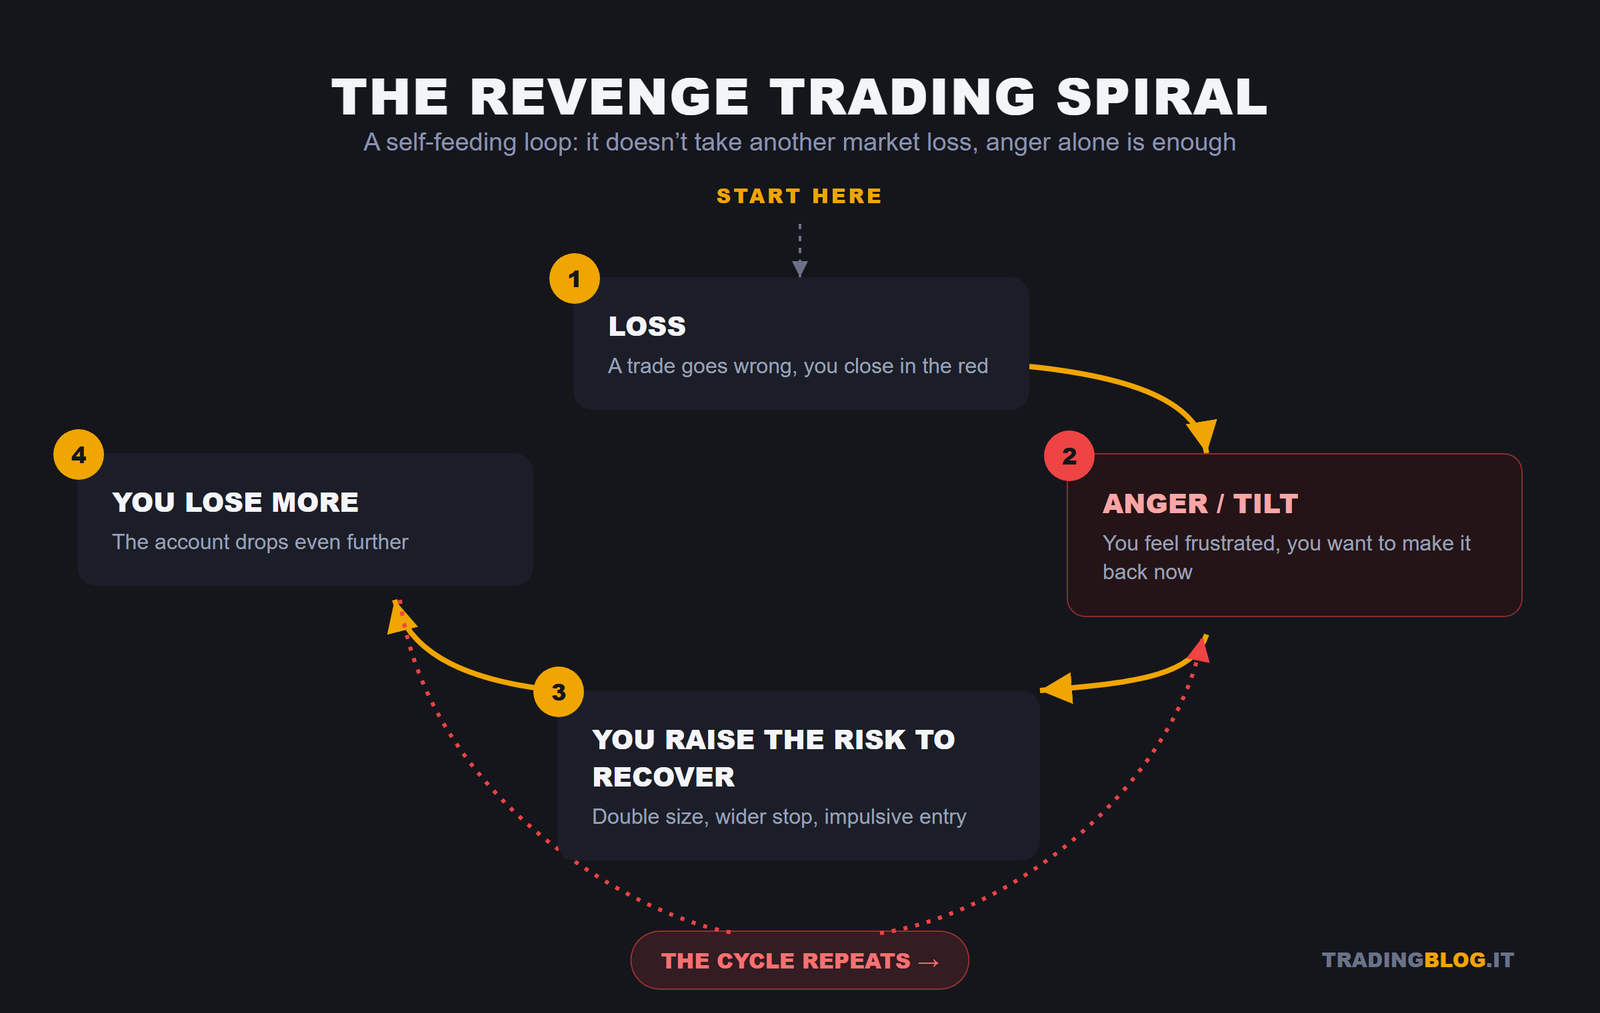
Put together, these three mechanisms create a spiral: you lose, you get angry, you raise the risk to recover fast, you lose more, you get even angrier.

The revenge trading spiral: loss, anger, increased risk, more losses
The cycle feeds itself: it doesn’t take another market loss, anger alone is enough to restart it.

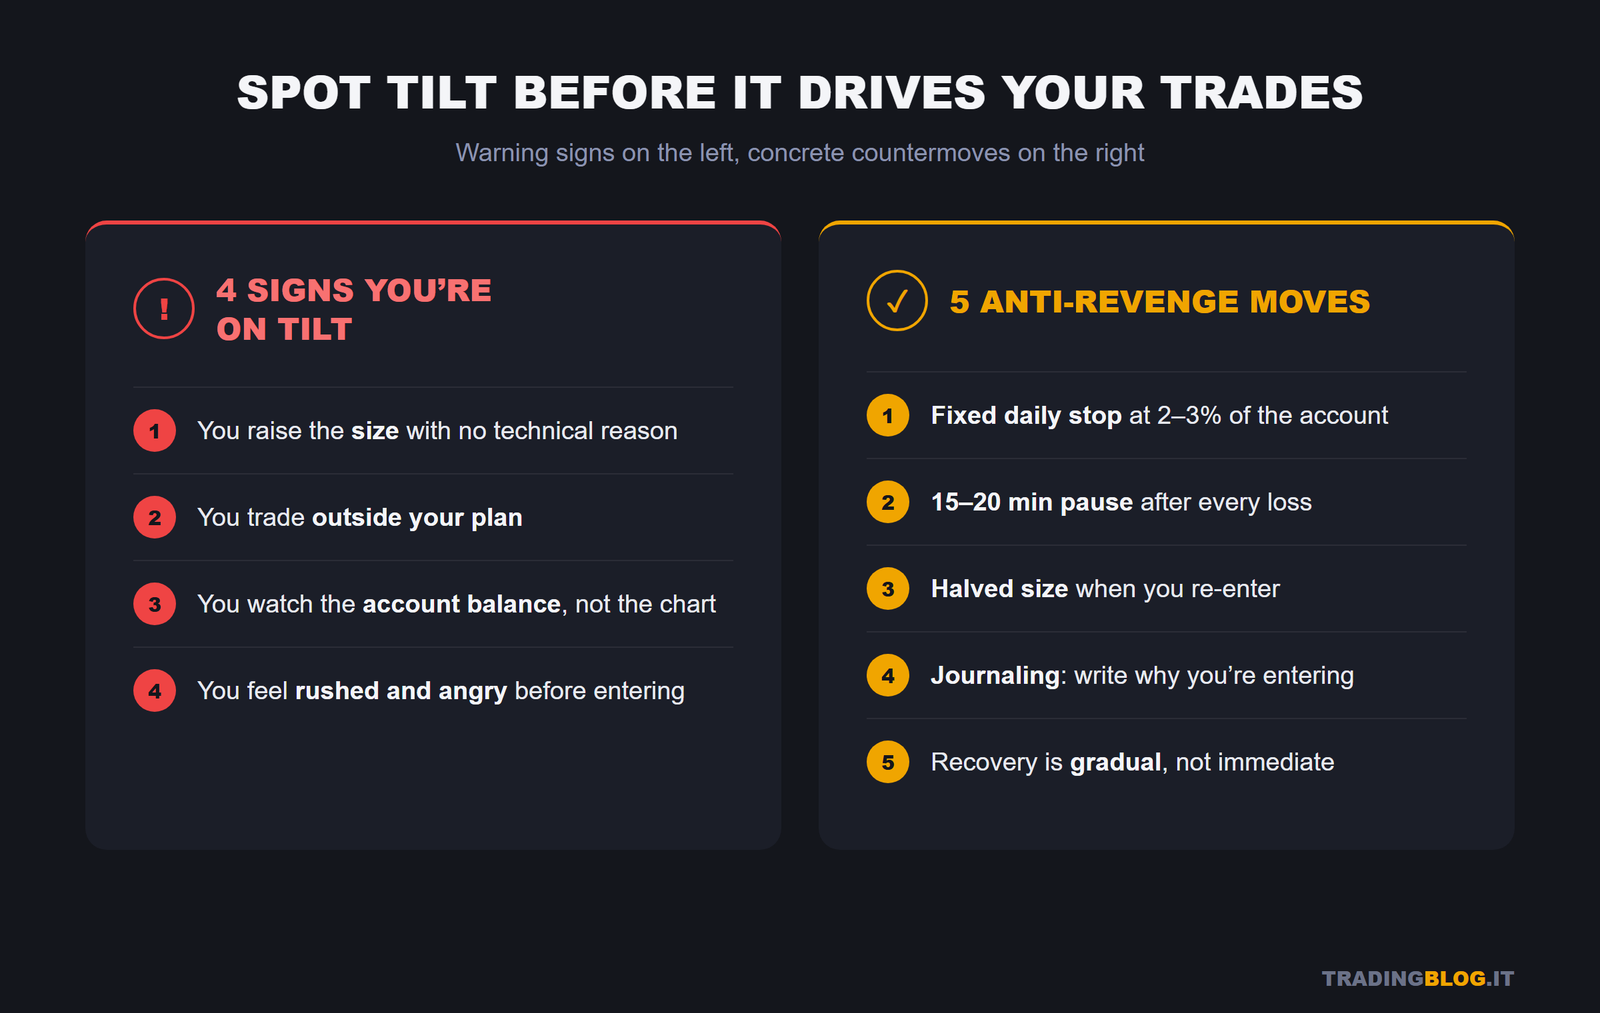
4 signs you’re on tilt

Recognizing the state is half the work. You might check these warning bells:

  • You raise the size with no technical reason. The lot grows not because the setup is better, but because “this way I recover faster.”
  • You trade outside your plan. You take trades you wouldn’t even look at with a cool head.
  • You watch the account, not the chart. Your compass has become the P&L in euros, not market structure.
  • You feel rushed and angry. Your body tells you: clenched jaw, short breath, the feeling of “having to make it back right now.”

If you recognize two or more at the same time, you’re most likely not trading. You’re taking revenge.

The 5-move anti-revenge protocol

The goal isn’t “more self-control”, which under stress evaporates. The goal is to build rules that decide for you when your head can’t be trusted.

1. Fixed daily stop. You might define a maximum daily loss in advance, for example 2-3% of the account. Once that threshold is hit, close the platform. Full stop. The decision has already been made by calm-you for angry-you.

2. Timed pause after a loss. After a stop, get up. A 15-20 minute timer before you can even think about the next trade. The emotional peak, physiologically, deflates on its own if you give it time. The break is there to rest your mind, not just to let the minutes go by: actually stand up, walk, look out of the window. If you eyeball the duration you will be back in three minutes, so let a timer decide for you: Thunder Focus, our free Pomodoro timer, keeps work and breaks apart and tells you when you can go back to trading.

3. Reduced size on re-entry. If you go back to trading after a losing streak, you might consider halving the size until you’re back in rhythm. You recover confidence, not the money lost. And rather than eyeballing the lot, work it out from the risk you set yourself with the Forex Lot Size Calculator.

4. Journaling. Before every trade after a loss, write one line: “why am I entering?” If the answer is “to recover,” you have your answer, and it’s not a setup.

5. The slow-recovery rule. Internalize that a loss isn’t “recovered” in one trade. It’s absorbed across dozens of disciplined trades. Rushing is the symptom, not the cure.

4 signs you're on tilt and 5 anti-revenge moves
Recognize tilt before it drives your trades: the warning signs and the concrete countermoves.

A numerical example

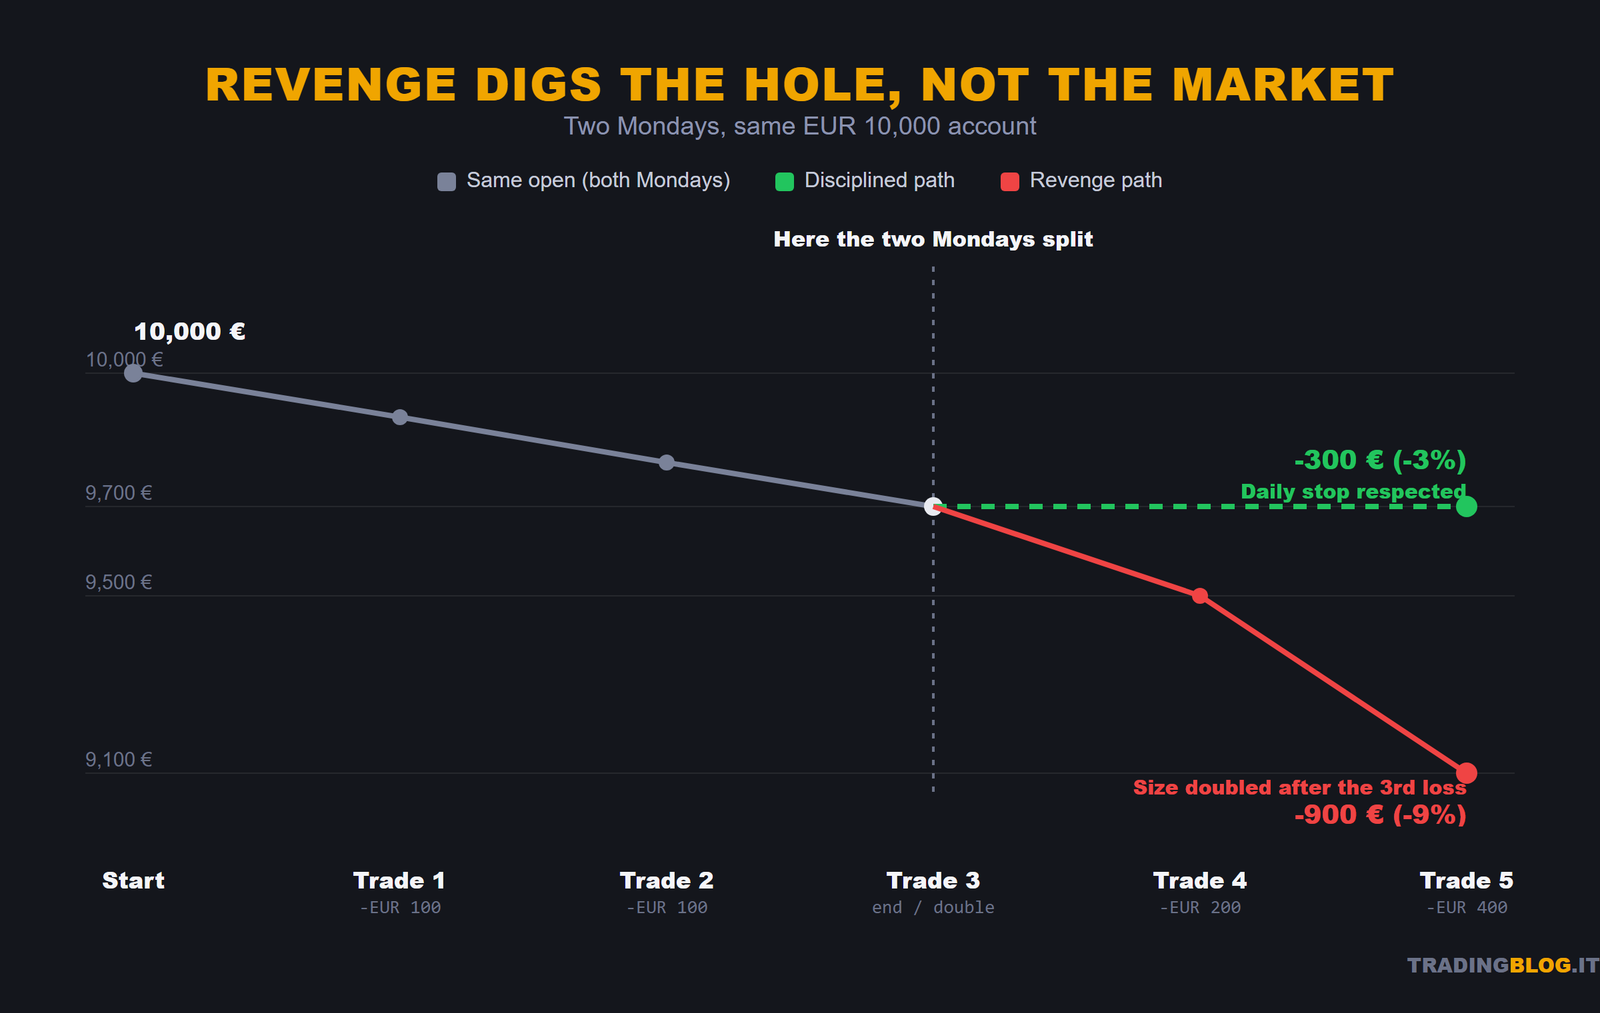
A €10,000 account. You risk 1% per trade, so €100.

Monday you take three stops in a row: -€300, you’re at -3% on the day. So far, normal trading math.

Then the spiral starts. “With €100 a trade I’ll never recover.” You double up: €200 per trade. Another stop, -€200. Now you’re at -€500 and even more on edge. You double again: €400. That one blows up too. -€900 in a single day, 9% of the account, when your rule said 2-3%.

The key point: the three initial losses were the cost of the job. The real hole, the one that hurts for weeks, was dug by revenge, not the market.

With the daily stop at 3%, that Monday would have closed at -€300 and Tuesday you’d have started fresh, intact.

Equity compared: disciplined path -300 euros vs revenge path -900 euros
Same account, same open: the difference between -3% and -9% was made by revenge, not the market.
A disciplined trader stopping in front of a glowing stop button
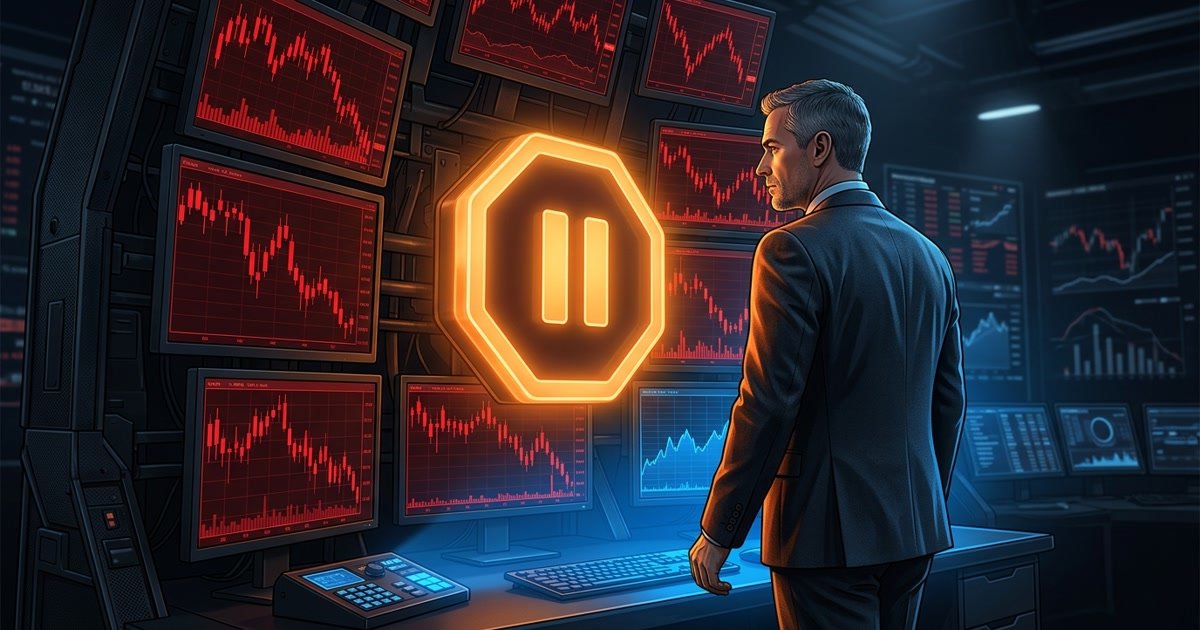
The strongest move, when the account is burning, is often to stop.

To try this week

Write down your daily stop-loss, a precise figure in euros or percentage, and stick it on a post-it on your monitor. This week, if you hit it, close everything. One single rule, applied for real, is worth more than ten good intentions.

Want to put your market reading to the test?Compete and challenge other traders inside an Arena, in a demo environment without risking real capital. Discover The Thunder Trader’s Performance Arena Event.

Enter the Arena →

Disclaimer: purely informational and educational content. It does not constitute financial advice or an invitation to trade. Trading involves the risk of capital loss.