Posts

An isolated gas station on an empty desert road at night, its canopy lit and the price sign dark, with an amber glow on the horizon

Wednesday’s CPI: the headline will look scary, but the real risk is somewhere else

Hi trader,

the last time I wrote to you about a CPI, on 11 September, the market had the Fed hike at 70%.

And I told you that 70% was the worst place to be caught by a data release.

Five days later the Fed really did hike, the first hike in more than three years, rates at 3.75-4.00%.

This afternoon the September CPI comes out, and the picture has flipped.

The market now puts the end-of-month hike at around 20%.

And I’ll tell you right away why that worries me more, not less.

What comes out today, and when

The US September CPI, the consumer price index.

The Bureau of Labor Statistics publishes it on Wednesday 14 October at 8:30 am New York time, which is 13:30 in London and here in the Canary Islands, and 14:30 in Italy.

Here is what the market expects, compared with August:

What Expected September August
Headline CPI, year on year 3.6-3.7% 3.4%
Headline CPI, month on month +0.6% +0.4%
Core CPI (ex food and energy), year on year 2.4-2.5% 2.4%
Core CPI, month on month +0.2% +0.3%

On the core, the forecasts are bunched almost entirely around +0.2%.

Keep that in mind, because that is where the risk is hiding.

Oh, and tomorrow, Thursday, producer prices come out too.

So this afternoon does not close the story, it opens a two-day stretch.

Today’s headline will look scary

I’m telling you in advance, so you don’t get a fright at 8:30.

A +0.6% on the month would be the strongest monthly rise since April.

The reason is always the same: gasoline.

In August gasoline in the CPI was already up 27.4% on the year, and energy as a whole 16.3%.

In September gasoline rose again, and at the end of the month diesel hit its all-time record, just above 6.5 dollars a gallon as a national average.

Brent is trading around 105 dollars these days.

On Sunday Trump announced an “energy truce” between Russia and Ukraine, no more attacks on energy facilities.

Moscow did not confirm it, the attacks carried on, and on Monday oil closed higher instead of lower.

And the Middle East, which is what pushed the barrel all the way up there, has not calmed down at all.

In plain words: today’s headline is written by the barrel, and these days the barrel is written by the news from the front lines.

And that is exactly why the headline, for anyone who trades, matters less than it looks.

At the Fed almost everyone knows it’s gasoline.

The market knows it’s gasoline.

The phone notifications will talk about “inflation at a multi-month high”, and they will be right, but that is not the number the end-of-month game is played on.

August’s core was dirty

And here comes the part almost nobody tells you.

In August the core came out at +0.3%, above the +0.2% expected.

The market noticed right away: short-term yields went up, because a core above expectations is exactly what the Fed does not want to see.

But if you open the report and look inside, a slice of that +0.3% was not inflation spreading.

It was two odd items.

Phone services, up 5.4% in a single month because of price hikes and plan changes at AT&T and T-Mobile, added about a tenth of a point to the core on their own.

And hotels, +2.4% after two months of similar declines, which is a rebound more than a trend.

Take those two things out and August goes back to being a normal month.

That is why almost everyone expects a September core at +0.2%: not because inflation is cooling, but because those two items don’t repeat.

It’s like a puncture in qualifying.

The lap time is bad, but it tells you nothing about race pace.

So what do I look at inside today’s core?

One item, before all the others: airline fares.

Because a plane ticket is a service, but there is fuel inside it.

In August flights were already up 23.4% on the year: the barrel has been passing from fuel into services for months, and the question is whether it speeds up.

That is still an indirect effect, fuel going into the price of a service.

The next step is the one the ECB had put into its projections in September, the second-round effect: wages and price lists adjusting.

That is where the price rise stops being gasoline and becomes something else.

Why this time the risk is all on one side

Back to that 20%.

How did we get there?

Up to 28 September the market had the end-of-month hike at around 70-75%.

Then in four days three things happened.

On 29 September John Williams, the president of the New York Fed, said there is no urgency and that another move could come towards the end of the year.

The October odds collapsed right there.

The next day August PCE, the index the Fed actually uses for its 2% target, came out a touch below expectations.

And on 2 October the September jobs report came out very weak, 29,000 jobs against an estimate of around 90,000, unemployment up from 4.1% to 4.2%.

Result: October almost priced out, and the whole bet moved to December, where a hike is priced at around 85%.

So the story the market has told itself is this: October on hold, December hike.

Now think about how a price built like that reacts.

If the core comes out at +0.2% today, the market says “I knew it”.

Movement, sure, but inside a script already written.

If it comes out at +0.3% or higher, above almost every forecast, that 20% for October is no longer a 20%.

And a bet that has to be repriced from 20 to 50 in one afternoon is far more violent than one going from 70 to 80.

In September the hike was in the price, and the data could only confirm it or disappoint.

Today the hike is almost priced out, and only one surprise really hurts.

There is also the opposite tail, and it’s not one to dismiss.

Core at +0.1% with a labour market creating 29,000 jobs, and someone at the table will start asking whether December is really needed.

The 85% for December would deflate, and that really would be a field day for equities.

Less likely, but possible.

My point is a different one: the market is leaning on a single story, and the dangerous afternoons are the ones when the story breaks.
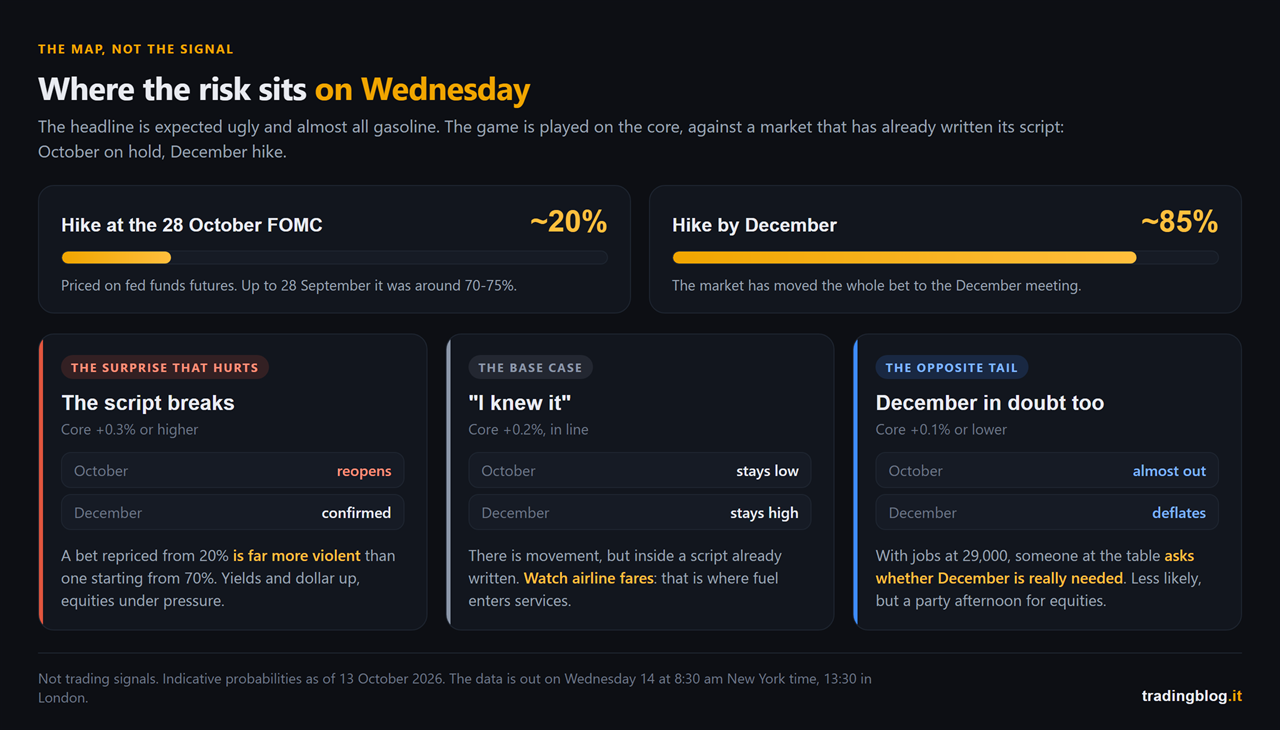
Diagram of where the risk sits on the September CPI: a Fed hike in October priced around 20% and in December around 85%, and what a core print of +0.3% or higher, +0.2%, or +0.1% or lower tends to move
Where the risk sits on Wednesday. With the October hike priced at around 20% and the December one at around 85%, here is what each core outcome tends to move. These are not signals, it is the map.

A Fed pulled two ways

There’s one last thing that makes this CPI different from September’s.

In September the Fed had one problem: inflation.

Now it has two, and they pull in opposite directions.

On one side prices rising because of energy, with the US 10-year above 5% and the president of the Cleveland Fed, Beth Hammack, saying rates need to be higher because inflation is broadening.

On the other a labour market that this year has created 68,000 jobs a month on average, and that in September created less than half of that.

The minutes of the September meeting say the committee sees another hike by the end of the year.

They don’t say when.

And when a central bank doesn’t say when, the data decides.

Today is the data.

How I handle it

The rules are the usual ones, because CPI days all look alike.

I don’t enter on the 8:30 spike.

First the market reads the headline, which today will be ugly and already expected.

Then it reads the core.

Then, if it’s someone who works properly, it opens the detail and looks at what’s inside.

The move that holds until the evening is almost always born at the second or third pass, not the first.

I show up with the map already drawn.

Calendar, levels, and where the options market has its walls on the S&P and the Nasdaq.

On a day like this part of the move is made by market makers hedging, not by the news, and that’s gamma exposure.

I check it on the Thunder Desk, which is free and puts the macro calendar and gamma on the same screen.

The point isn’t the tool, it’s opening it in the morning, not at 8:29 with the position already open.

I cut size before, not after.

If a position is still alive at 8:30, the spread can widen and the stop can get filled a few ticks further away.

What that scenario really costs me I work out now, with numbers, not by eye.

And I log the reaction, not the result.

What I expected, what came out, what price did in the first five minutes and what it did by 10 am.

Do it today, and do it again at the end of the month with the FOMC.

A few days like this in the diary and your recurring behaviour around macro data shows up on its own.

Three takeaways

  1. Today’s headline will be ugly, and it’s already written. Headline expected at +0.6% on the month and 3.6-3.7% on the year, almost all energy, meaning gasoline. That’s not where October is decided.
  2. August’s core was inflated by two items that don’t repeat. A +0.2% today doesn’t mean inflation is cooling, and inside it airline fares are worth watching, the point where the barrel enters services.
  3. The market has already decided: October on hold, December hike. With October at around 20%, the surprise that hurts most is a core at +0.3% or higher. You don’t need to guess it, you need to know beforehand what you do if it comes.

If you missed the previous episodes, the piece on the August CPI is where the headline versus core discussion started, and the piece on the September hike explains why from here on every inflation print weighs double.

The dangerous number is not the one the market fears. It’s the one the market has stopped fearing.

— tradingblog.itPosta su X

I’ll close with what I tell myself every time I see a calm market before a release.

Calm doesn’t mean safe.

It means everyone has bet on the same story.

Suerte Amigo!

Tiziano Brunno

Tradingblog

Want to put your market reading to the test?

Compete and challenge other traders inside an Arena in a demo environment, with no real capital at risk. Discover the Performance Arena Events by The Thunder Trader.

Discover The Thunder Trader →


Disclaimer: purely informational and educational content. It does not constitute financial advice or an invitation to trade. Trading involves the risk of capital loss.


A stone staircase climbing through the darkness towards an amber glow at the top, between rocks and dark structures, with no end in sight

It was not a move. It was the start of a cycle.

Hi trader,

on 16 September the Fed raised rates for the first time in more than three years.

In the six days that followed the Nasdaq printed two record highs in a row and the VIX fell 20%.

If your reaction is “the market did not get it”, stop for a second. Because the numbers say the opposite: the market got it perfectly well, and what it got is more interesting than the hike.

Ok, vamos.

What happened, in three lines

Twenty-five basis points, from 3.50-3.75% to 3.75-4.00%. Vote unanimous, twelve to zero, no dissent. First hike after more than three years of standing still or cutting.

You read all of that everywhere on 16 September, and a week later it is worth nothing.

What is worth something sits in the projections the committee publishes alongside the decision.

The real headline is not 2026. It is 2027.

Alongside the decision, the committee publishes its own rate projections. Eighteen dots on a chart, which become seventeen on the years further out, because one participant did not submit projections for 2028 and 2029.

2026 is the part that ended up in the headlines: at least one more hike by year end, say sixteen dots out of eighteen.

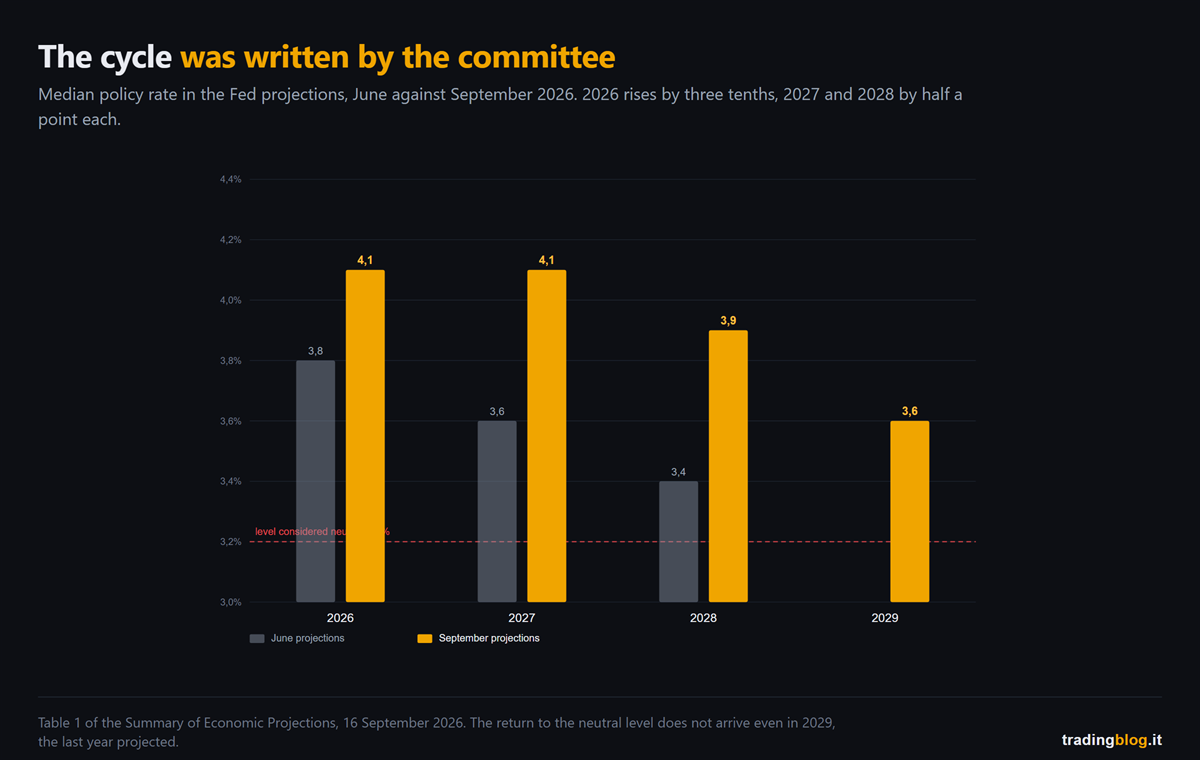
But look at what happened to the years after that, comparing the September projections with the June ones.

Bar chart comparing the median policy rates in the Fed projections from June and September 2026: every September bar is higher than its June counterpart, and none comes down to the line marking the 3.2% neutral level
The median rates in the committee’s projections, June against September 2026. 2026 rises by three tenths, 2027 and 2028 each rise by half a point.

The median for 2027 went from 3.6% to 4.1%. Half a point in three months.

The one for 2028 from 3.4% to 3.9%. Another half point.

And the trip back to the level they themselves consider neutral, 3.2%, never arrives at all. Not even in 2029, which is the last year projected: there the median does come down, but only to 3.6%.

Read it the way a trader would read it and not a journalist. The committee did not write “we hike once and then we see”. It wrote that rates go to 4.1% and stay there for two years, that in 2028 they come down to just 3.9%, and that at the end of the forecast horizon they have still not gone back to the level considered neutral.

That is not an isolated move. It is a high level held for years, written by the people who have to hold it. And in a moment you will see that the market expects even more than that.

And the market? It said they were right.

Here comes the part that flips your instinct.

When a central bank starts hiking, the script everyone expects is: equities down, volatility up, credit spreads widening, yields up all along the curve.

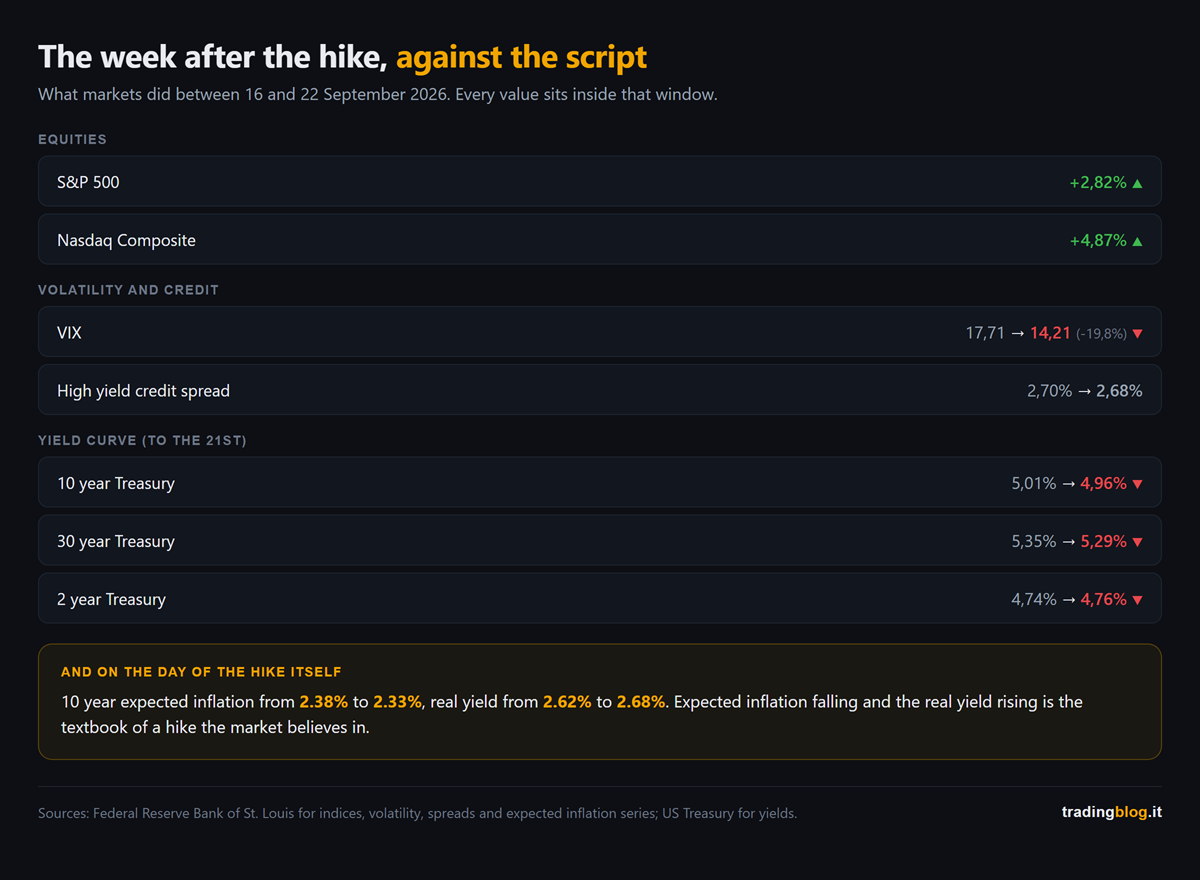
Between 16 and 22 September none of that happened. The numbers in this section sit inside that window, with two exceptions I flag as they come: the yield curve, which stops on the 21st, and the last data point, which measures the reaction of a single day.

Table of market moves between 16 and 22 September 2026: equities up, volatility sharply down, credit spreads almost flat, ten and thirty year yields down and the two year yield up
What markets did between 16 and 22 September 2026. Equities up, volatility down, credit spreads flat, and yields lower all along the curve.

The S&P 500 did +2.82% and the Nasdaq +4.87%, with a record high on the 21st and another on the 22nd.

The VIX went from 17.71 to 14.21, so minus 20%, at the lows of the month. Anyone selling volatility on the day of the first hike in three years was right.

High yield credit spreads did not widen by a single point: 2.70% on the day of the hike, 2.68% on the 22nd. A credit market that fears a squeeze does not sit that still.

And now look at the yield curve, where the data stops on the 21st because that is the last day published.

The two year went up, from 4.74% to 4.76%. The ten year went down, from 5.01% to 4.96%, and the thirty year from 5.35% to 5.29%.

Short end up, long end down: the curve flattened by seven basis points. And it is the same thing the earlier numbers say, put another way: the market expects more tightening now and less inflation later.

But the number that explains everything is another one, and it is the subtlest. This is the only one that falls outside the window, because it measures the reaction of a single day: it compares the close on the 15th with the close on the 16th.

On the day of the hike ten year breakeven inflation fell, from 2.38% to 2.33%, while the real yield rose from 2.62% to 2.68%.

And now the honest part, the one they usually do not tell you.

Ten year breakeven inflation is very sensitive to oil, and crude started falling exactly around those days. So a slice of that drop may be the barrel, not the Fed. Anyone selling you only the first half of the number is selling you a thesis, not a measurement.

But oil does not explain the other half. Crude falling pushes breakeven inflation down, it does not push the real yield up. Those six basis points of extra real yield on the very day of the decision are the one thing the barrel cannot account for, and that is where the thesis holds up.

Breakeven inflation down and real yield up, together, is what happens when the market believes the central bank will do its job. It is the textbook of the hike that works, not of the one that scares.

The market did not ignore the Fed. It believed it.

Where the market does not agree

There is one point where market and committee see it differently, and it is not the one you think.

On the next meeting, 27 and 28 October, futures gave 54% odds to another hike as of 22 September. A coin flip.

But looking out to December, the probability of being at least twenty-five basis points higher is 90%.

On direction they agree. The disagreement is on the when, and on the how much.

Over the next nine meetings fed funds futures were pricing, as of 22 September, around eighty basis points of total tightening, so roughly three hikes. The dot plot median forecasts one.

The market is pricing a longer cycle than the one the committee put on the dots.

And the two things I have just written do not contradict each other, they hold together: the market expects more hikes than the committee forecasts, and that is exactly why it expects less inflation.

What changes for anyone trading inside the day

This is the part that really concerns you, and it has nothing to do with forecasts.

The Fed chair, in the press conference, said two things that put together change the job.

The first: “I’m not in the forward guidance business”.

The second, explaining how he looks at the data: “data point dependence is a dangerous preoccupation”. Trends count, he said, single numbers are noise.

And he does not put his own dot on the dot plot, as he already did in June.

Translated into practice: the guidance the market had used for ten years to price meetings has been switched off by the people who issued it.

The market will keep pricing every single data point though, because that is what the market does. So the reactions to macro numbers are still there, and my expectation is that they get wider: with a central bank that refuses to guide, nobody confirms them or denies them the day after.

For anyone trading inside the day that is a concrete asymmetry: the move on the number is there, the confirmation that used to come afterwards is gone. You trade the reaction, not the anticipation, and to do that you need to know when the number lands.

The dates that really count

They are not all the same, and two of them weigh more than all the others put together.

Friday 2 October, the September jobs report. The committee projects unemployment flat at 4.1% for the next four years, so it expects no cost on the labour side. A weak jobs number is the thing most likely of all to change the committee’s mind from the inside. With one honest caveat: the standard the chair has set himself is declaredly about inflation, not about employment.

Wednesday 14 October, September inflation. It is the last consumer price print before the meeting on the 28th, and the chair said in the press conference that he builds his own estimates precisely on that one and on producer prices. It is the number that decides whether the next hike is in October or in December, and on that day the coin flip I mentioned above resolves one way or the other. The day after, on the 15th, producer prices come out, the second of the two numbers the chair builds his estimate with.

And be careful not to get confused: that number does not decide the committee’s mind, it decides the price. The chair has just said that he does not look at single numbers. The market does, and that is where the odds move.

Before those, on Wednesday 30 September, the August PCE comes out. It serves to check an estimate the chair made out loud in the press conference, and if it comes in above, the squeeze gets firmer.

And one to write down: the 28 October meeting has no dot plot. Statement and press conference only. The next update to the dots is in December.

A note on what can go wrong

The chair gave three reasons for the hike: an economy stronger than expected, inflation not coming down enough, and geopolitics.

The third has already moved, but not in the simple way. Crude had spiked all the way to 107 dollars on 15 September, the day before the decision, and from there it came back toward ninety, pushed by the diplomatic openings on Iran and by the expectation that Saudi Arabia will restart a major pipeline.

Watch out though: that is the unwinding of a spike, not a collapse. The barrel is still above late August levels. If it falls further, part of the job gets done by oil from the outside without the committee having to change its mind. If it climbs back up, it puts back in play one of the very reasons they hiked.

A note, because the week has already turned

What you have read above is the week from the 16th to the 22nd. On the 23rd the wind changed: equities came off the highs and the ten year yield went back up toward 5%, precisely on the fear of more hikes.

It does not disprove anything. If anything it confirms the more uncomfortable part: the market is not pricing less tightening, it is pricing more.

The circle we close

On 11 September, on this blog, we wrote that the number that decides the Fed is not the headline one but the core, and we argued it with the projections the ECB published the day before, where from 2027 onward core stays above the headline.

Five days later the Fed hiked, and its projections say exactly the same thing from the other side of the Atlantic: headline inflation coming back down first, core lagging behind, and rates that as a result stay high for longer.

Two central banks, same diagnosis. If you missed that piece, Friday’s CPI: the number that decides the Fed is not the headline is where this conversation started.

Breakeven inflation falling and the real yield rising is not a market ignoring the central bank. It is a market that believes it.

— tradingblog.itPosta su X

Let me close with the thing I wrote down in my notebook that evening.

For ten years we traded inside a system where, after every data release, somebody turned up to tell you how to read it.

That somebody has just said he will not be doing it any more.

It is not good news and it is not bad news. It is simply that noise now stays noise for longer, and the job goes back to being reading the reaction instead of waiting for the explanation.

Suerte Amigo!

Tiziano Brunno

Tradingblog

Want to put your market reading to the test?

Compete and challenge other traders inside an Arena in a demo environment, with no real capital at risk. Discover the Performance Arena Events by The Thunder Trader.

Discover The Thunder Trader →


Disclaimer: purely informational and educational content. It does not constitute financial advice or an invitation to trade. Trading involves the risk of capital loss.
An oil tanker in the dark on a black sea, backlit by an amber glow on the horizon

Friday’s CPI: the number that decides the Fed is not the headline

Hi trader,

yesterday afternoon the ECB raised rates.

Second hike of the year, deposit rate at 2.50%, effective from 16 September.

And the curious part is the reason why.

Not because the European economy is running hot, it is growing 0.9% this year, which is barely more than nothing.

It hiked because the war in the Middle East keeps pushing on prices, and because that increase has stopped being just energy.

Let me walk you through it properly, because it is exactly the same question America will be asking itself on Friday afternoon.

What comes out on Friday, and when

It is the US CPI for August, the consumer price index.

The Bureau of Labor Statistics publishes it on Friday 11 September at 8:30 am New York time, which is 1:30 pm here in the Canaries and in London, and 2:30 pm in central Europe.

There are two numbers inside it, and most people only look at one.

What August forecast July (released 12 Aug)
Headline CPI, year on year 3.3% 3.4%
Headline CPI, month on month +0.4% +0.1%
Core CPI (ex food and energy), year on year 2.4% 2.5%
Core CPI, month on month +0.2% +0.2%

The headline is the big number, the one that shows up in your phone notifications at 8:30 and one second.

The core is the same index without food and energy, which are the two components that swing the most.

It sounds like a detail for economists.

It is the detail that decides what the Fed does next Wednesday.

One clarification that matters, because almost nobody spells it out: the Fed does not measure its 2% on the CPI, it measures it on the PCE, which comes out two to three weeks later.

Friday’s CPI is the first taste, and it is the one the market moves on.

But keep the number in mind: in July the CPI was at 3.4% and the PCE, the index the Fed actually watches, at 3.7%.

Why the big number lies this year

Look at the forecasts in that table.

Headline monthly going from +0.1% to +0.4%, so four times as much.

And meanwhile the annual headline goes down, from 3.4% to 3.3%.

Core moving by one tenth instead, from 2.5% to 2.4%.

If Friday comes out like that, the message is not “US inflation is taking off again”.

The message is “US inflation is being made by the barrel”.

Brent above 100 dollars, a 4% jump yesterday that took it into the 105 area on yet another attack on commercial shipping, pump prices following in stages, half the increase within two weeks and the rest over the month and a half after that.

And it is not just a forecast any more.

Yesterday US producer prices for August came out at +5.4% year on year, and more than three quarters of the monthly increase is energy: +4.2% in thirty days, with diesel at +24%.

Producer prices are the floor above, the one the consumer sees a few months later.

This is called cost-push inflation, inflation that comes from the supply side.

It does not come from people buying too much, it comes from something costing more because getting it here has become complicated.

And there is very little a central bank can do about inflation that comes from the supply side.

Raising rates does not reopen a strait and does not make a tanker arrive any sooner.

The old textbook says a central bank should “look through” a supply shock, because it fades when the shock fades.

The problem is that the textbook holds only as long as that increase stays locked inside energy.

The detail the ECB put right in front of you yesterday

And this is where yesterday becomes useful, instead of just being an item on the evening news.

Look at the projections the ECB published yesterday, the ones from its own staff:

Year Headline inflation Core inflation
2026 3.0% 2.5%
2027 2.5% 2.6%
2028 2.1% 2.3%

Did you notice?

In 2027 and 2028 the ECB expects core to be higher than the headline.

And there is one more detail: it revised that 2027 and 2028 core up by a tenth compared with June.

It does not just expect the second round, it expects it a shade stronger than it did three months ago, and it puts that down to an economy holding up better than forecast and to wages growing a little faster.

Translated: it expects energy to come back down, and it expects that by then the increase will already have passed into everything else.

Transport costing more, so goods costing more, so services, so wages asking to catch up.

They are called second-round effects, and they are the only thing that justifies a hike in the middle of a war.

It did not hike because of the barrel.

It hiked because the barrel is getting into places it does not come out of.

Lagarde said two things in the press conference worth keeping: that this hike was “a no brainer”, an obvious call, and that she cannot anticipate what the next move will be.

No commitment to a rate path, decisions taken meeting by meeting.

The exact same words you will hear on Wednesday from the other side of the Atlantic, want to bet?

Why Friday carries more weight than usual

Because the Fed decides on 16 September.

Two-day meeting, the 15th and the 16th, decision on Wednesday afternoon, and this time there is also the dot plot.

The dot plot, let me explain, is that chart of dots where each of the people sitting at the table, including the ones who do not vote this year, marks where they see rates at the end of this year and in the years after.

Nobody signs their own dot, so nobody really commits, but the cloud of dots tells you which way the wind is blowing inside the room.

It comes out four times a year. The last one was in June. The next one is Wednesday.

And it lands at an unusual moment.

US rates have been sitting at 3.50-3.75% for five meetings.

In July three members voted against, and not to ask for a cut: to ask for a hike.

Then on 28 August, at Jackson Hole, Fed Chair Warsh talked about credibility and about a 2% target with no discounts, and the odds of a September hike almost doubled in three days, from 35% to 66%.

And yesterday the market changed its mind in half an hour.

That producer price print pushed the bet on Wednesday’s hike from about 60% to about 70% on futures, and prediction markets toward 63%.

That is why Friday is not just another data point.

It is the last inflation print before a decision that is already half priced, but not closed.

And a market at 70% is the worst place to be caught by a data release: the hike is in the price enough not to pay you if it lands, but not enough to protect you if it does not.

And afternoons where one number can still move a decision that is already half written are the afternoons when the chart does not forgive a lapse in attention.

The four roads the afternoon can take

I am not giving you entry signals, of course not.

I am giving you the map, so that whatever comes out at 8:30 does not catch you open-mouthed.

Hot headline on the month, cool core. The consensus scenario. This is the “it is all fuel” case: the Fed can say it is letting that increase pass through, the hike bet deflates a little, yields take a breath and equities get some air. Careful though, it is relief with an expiry date stamped on it, because with Brent up there the same question comes straight back next month.

Hot headline, hot core. The worst one if you hold bonds and equities. It means the barrel is already inside the rest of the basket, exactly the scenario the ECB put in writing for Europe yesterday. Here Wednesday’s hike becomes the main bet, the dot plot shifts up, the 10-year, which yesterday was trading around 4.9% and sits at its highest since late 2023, goes looking for the next threshold and equities pick up the bill.

Headline in line, core below forecast. The best one for equities. The hawks are left without ammunition for a week and the market celebrates. It is also the scenario where it is easiest to fall in love with the move and stay long into Wednesday, which with a dot plot on the way is an elegant way of giving the profits back.

Everything below forecast. The hike prices out, and the old “weak data, kind central banks, buy everything” reflex is back. But watch out: this Fed chair has built the first months of his term on the credibility argument. A good print does not change his problem, it postpones it.

Diagram of the four combinations of headline and core CPI, with the market's typical reaction in each case
The four combinations of headline and core, and what the market tends to do in each one. These are not signals, they are the four ways the afternoon can go.

How I handle it

Three practical things, all of them learned the expensive way.

I do not enter on the spike.

I do not trust the first candle at 8:30, and not for psychological reasons so much as technical ones: wider spreads, slippage, prices going one way and coming straight back in the time it takes you to read the headline.

The market reacts to the big number first, then reads the core, and only then really makes up its mind.

In my diary, the move that holds into the close is almost never the first one.

I look at where the walls are before the number is out.

On a day like this, part of the move is not made by the news, it is made by the levels where the market is already loaded with options and market makers have to hedge.

That is not black magic, it is gamma exposure, and knowing where those levels sit changes how you read a spike.

The macro calendar and the gamma on the S&P and the Nasdaq are on the Thunder Desk, they are free, and they spare you the classic scene of a trade left open by accident thirty seconds before the release.

Open it in the morning, not at 8:29.

I cut size before, not after.

If you have a position going into Friday afternoon alive, you do the maths now on what you actually lose if the stop goes with a double spread, with numbers, not by eye.

And I write everything down.

Not the result, the reaction: what I expected, what came out, what price did in the first five minutes and what it did at 10 am.

After three or four macro releases logged in the diary you start noticing that you, personally, have a recurring behaviour on days like these.

It is almost always the same mistake, and it is almost always an expensive one.

Three things to take home

  1. Friday’s big number and the number that moves the Fed are two different numbers. Monthly headline expected to accelerate hard on energy while the annual one falls. Core expected to sit still. It is the distance between the two that tells you whether this inflation is a barrel of oil or something deeper.
  2. The ECB showed you the criterion yesterday. It hiked looking not at the headline but at a core that in its own projections stays above the headline in 2027 and 2028. When a central bank fears second-round effects, the hike arrives even in the middle of a war and with growth at 0.9%.
  3. Wednesday brings the dot plot, and the hike is already 70% priced. An inflation print landing five days before a decision that is almost made but not signed is worth double the usual. You do not need to guess it. You need to not be surprised by it.

If you want the wider picture, the piece on what was at stake at the Fed at the end of July and the one on what a strong dollar does to your trades still hold up, the context has changed less than it looks.

The headline tells you what fuel costs. The core tells you whether the problem is the fuel or you.

— tradingblog.itPosta su X

Let me close with the thing I repeat to myself every time there is a big release on the calendar.

My job on Friday at 8:30 is not to guess the number.

It is to know in advance what I do in each of the cases, and to have already decided which of those cases keeps me out of the market.

The rest is noise.

Suerte Amigo!

Tiziano Brunno

Tradingblog

Want to put your market reading to the test?

Compete and challenge other traders inside an Arena in a demo environment, with no real capital at risk. Discover the Performance Arena Events by The Thunder Trader.

Discover The Thunder Trader →


Disclaimer: purely informational and educational content. It does not constitute financial advice or an invitation to trade. Trading involves the risk of capital loss.
Vast deserted open-plan office at night, rows of empty desks fading into darkness and a single desk lit by an amber lamp, an image of the frozen American labour market

Friday’s NFP: this time bad news is not good news

Hi trader,

on Friday at half past eight in the morning, New York time, the US employment data comes out.

Nothing new so far. First Friday of the month, the payrolls, the chart sitting still all morning and then doing in ninety seconds what it hasn’t done in three days.

Except this time there’s a detail almost nobody will mention in Friday afternoon’s headlines.

The reflex they taught you, “weak data, the Fed cuts, stocks celebrate”, doesn’t work this year.

In fact, it could cost you dearly.

Let me walk you through it properly, because there are a couple of things to line up first.

What comes out on Friday, and when

The report is called the Employment Situation, it’s published by the Bureau of Labor Statistics, and it covers the month of July.

It lands on Friday 7 August at 8:30 am New York time, which is 1:30 pm in London and the Canaries, and 2:30 pm in central Europe.

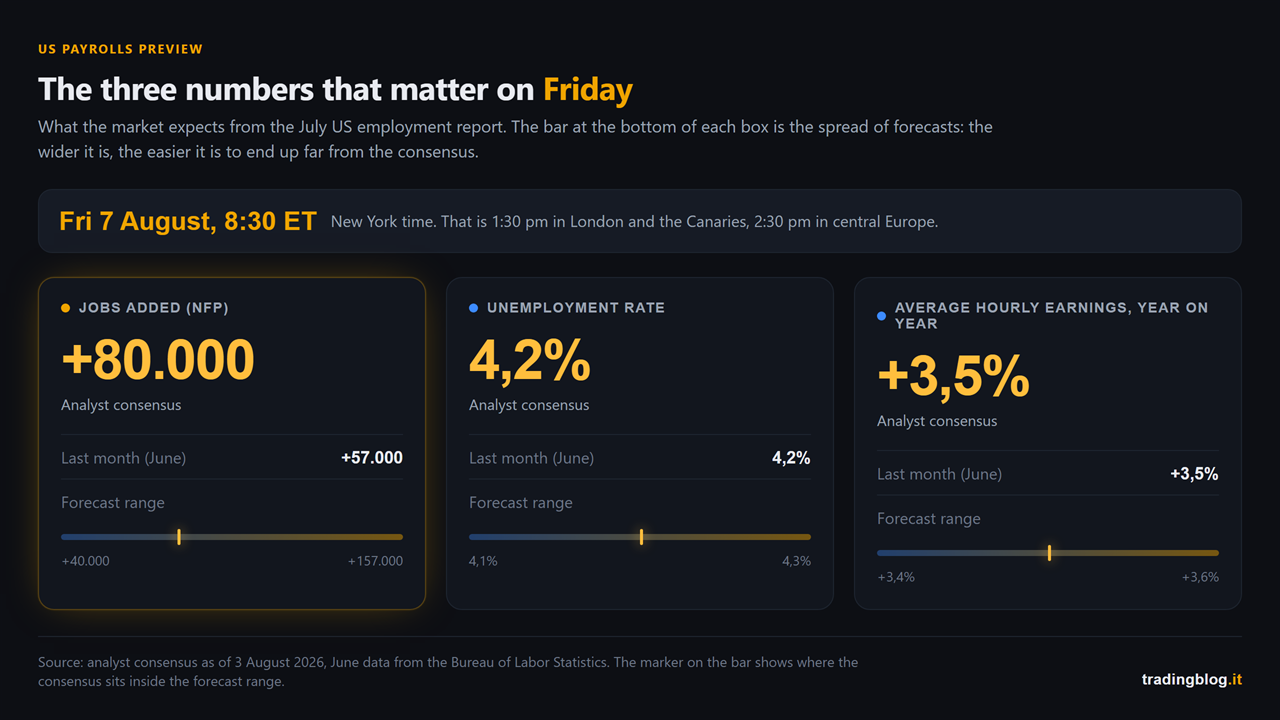
Inside it there are three numbers that move price:

What Expected Last month
Jobs added (NFP) +80,000 +57,000
Unemployment rate 4.2% 4.2%
Average hourly earnings, year on year +3.5% +3.5%

The consensus on jobs is +80,000, but the spread of forecasts is wide: it runs from 40,000 to 157,000. Deutsche Bank sits low, around 65,000. UniCredit sits high, around 110,000.

Translation: nobody actually knows. With 117,000 jobs between the lowest estimate and the highest, anyone positioned on the consensus can end up a long way from the real number.

On the unemployment rate the consensus is 4.2%, with some seeing 4.1% and some 4.3%.

On wages, +3.5% year on year, basically flat.

Scoreboard with the three numbers expected from the US employment report of Friday 7 August: 80,000 jobs added, unemployment rate at 4.2% and average hourly earnings up 3.5% year on year, each compared with the June figure and with the range of analyst forecasts
The three numbers landing on Friday at 8:30 am ET, with the forecast range. The consensus is just the centre of a very wide spread.

The context that flips everything around

Right, now the part that matters.

On 29 July the Fed left rates where they were, between 3.50% and 3.75%. Fifth time in a row. Boring so far.

But look at how they left them there: a 9 to 3 vote, with three members voting against because they wanted to raise them.

Not cut them. Raise them.

Three dissents all in the same direction hadn’t happened since September 2016. And Kevin Warsh, at the press conference, said the Fed “will deliver price stability” and that, where necessary, it will not hesitate to act.

The result is that the market today is not pricing a cut in September. It’s pricing a hike, with a probability that was running around 55-65% at the start of the week and that moves every day along with the price of oil (the Strait of Hormuz negotiations have pushed crude down, and part of that probability with it).

The US 10-year yield is sitting around 4.6%.

You can see where this goes, right?

If the Fed is thinking about hiking because of inflation, weak employment data doesn’t automatically hand it a cut. It hands it a problem. Because inflation is still there, pushed by energy, and meanwhile the labour market is slowing.

That’s called stagflation, and it’s the scenario markets hate most. There’s no helping hand from the central bank coming to save you.

(I wrote about the end of July meeting and Warsh’s tone here: the Fed on 29 July, what to watch. It’s the backdrop to this whole piece.)

The clues already out this week

We’ve had two tasters already.

The first: yesterday’s ADP. It’s the private sector jobs report that comes out two days before the payrolls. In July it printed +44,000, against the 70,000 expected. It’s the weakest reading since January.

A word of caution though, and I have to be straight with you: ADP is not a good predictor of the payrolls. That’s not me talking, ADP writes it themselves at the bottom of their release, where they specify that the report isn’t designed to forecast the BLS number. They’re two different surveys with different methods (ADP counts who is on the payroll, the BLS counts who actually got paid in that particular week), and over the years they’ve contradicted each other plenty of times. It’s useful for a sense of direction, not for guessing the number. Anyone who tells you on Friday “I saw it coming from the ADP” guessed right, they didn’t work it out.

The second: the jobless claims. In the week ending 25 July there were 197,000, with the four-week average at 202,750. And the week before that it was 187,000, the lowest level since 1969.

Very low numbers.

And here’s the real photograph of the American labour market right now:

they’re not firing, but they’re not hiring either.

Low claims tell you that whoever has a job is holding on to it. Weak payrolls tell you that whoever is looking for one is having a rough time finding it. The job openings data out on Tuesday backs it up: the layoff rate is stuck at 1.1%, which is very low, but the number of people quitting to change jobs is also near the bottom.

It’s a frozen labour market, not a labour market in crisis. And that’s how unemployment stays nailed to 4.2% even with hiring numbers this thin.

At least, that’s the official version. Because underneath there’s something else.

The number that really matters isn’t the headline

Last month something happened that explains why you can’t stop at the first line.

In June the unemployment rate fell, from 4.3% to 4.2%.

Good news, right?

No.

It fell because 720,000 people left the labour force. The participation rate collapsed by three tenths, to 61.5%, the lowest since March 2021 and, Covid aside, since 1976. The household survey counted 507,000 fewer people in work.

The unemployment rate is the ratio between people who are looking for work and can’t find it and the total labour force, meaning employed plus unemployed together. But to land in the unemployed group you have to have looked for work in the last four weeks. If you stop looking, you drop out of the labour force, you vanish from the count, and the rate improves.

The rate fell because people gave up. Not because they found work.

That’s why on Friday, when you see 4.2% or 4.1%, the right question isn’t “did it go up or down”. It’s why.

And if instead it climbs to 4.3% because people came back looking for work, that’s a completely different story, and far less dramatic than the headlines will make it sound.

But the number that really rules the room, with this Fed, is wages.

If hourly pay accelerates beyond 3.5%, the Fed sees fuel on the inflation fire and the September hike is back on the table. If pay slows down, the hawks lose an argument.

Look at that line before you even look at the headline. That’s what sets the tone of the afternoon.

Revisions, the favourite trap

Last trap, and the most underrated.

Every report revises the two previous months. And lately the revisions have been brutal: in the June report, April and May together were cut by 74,000 jobs.

Which means the number you traded two months ago no longer exists. It’s been rewritten.

Friday could easily print a +90,000 headline with a minus 60,000 revision to the months before. Green headline, red substance. The first move goes with the headline, the second move goes with the substance, and whoever reads only the first line ends up on the wrong side when the market turns back around.

And put this date in your diary, because it’s the big chapter of the same story: on 28 August the preliminary estimate of the annual benchmark revision comes out, the one that recalibrates the entire series. There they don’t rewrite two months, they rewrite a year.

The four scenarios

I’m not giving you entry signals, obviously. I’m giving you the map, so that whatever comes out doesn’t catch you open mouthed.

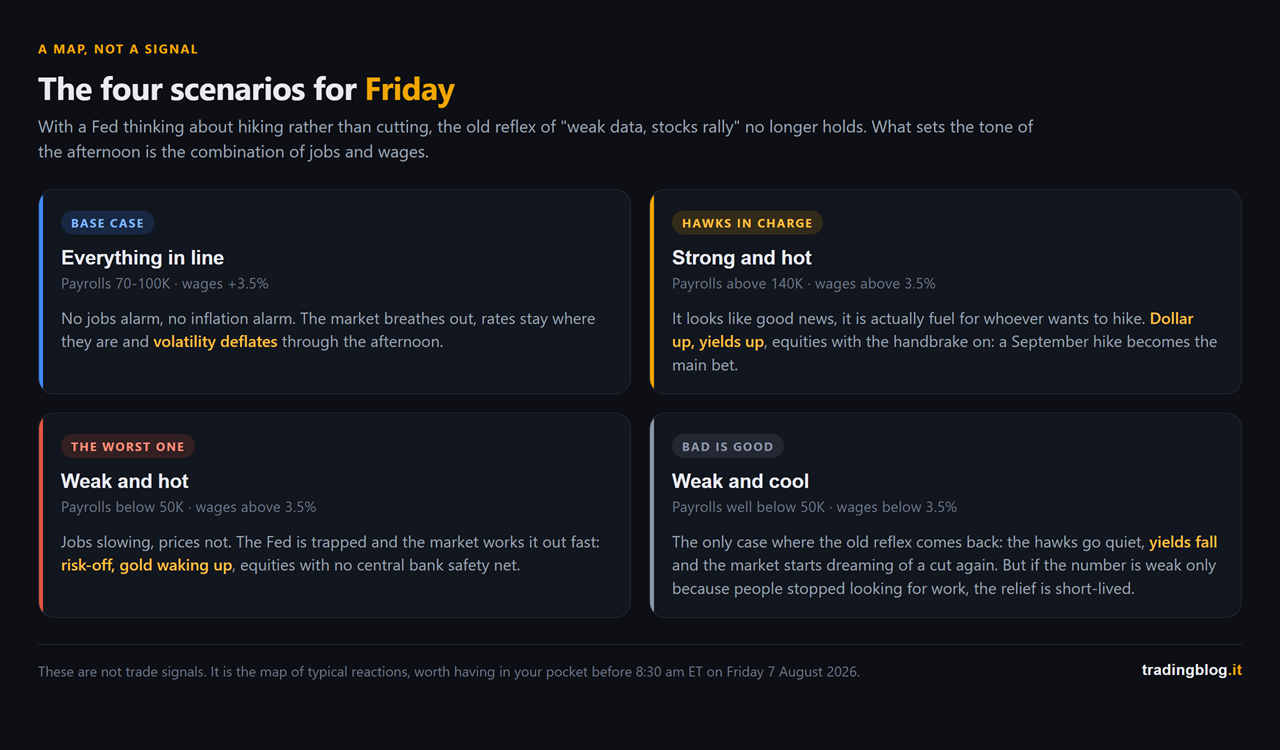
Payrolls in line (70-100K) and wages at 3.5%. The most digestible scenario for equities. No panic on jobs, no inflation alarm. The market breathes out, rates stay where they are, volatility deflates through the afternoon.

Strong payrolls (above 140K) and hot wages. It looks like good news and it’s actually fuel for the hawks. Dollar up, yields up, equities with the handbrake on because a September hike becomes the main bet.

Weak payrolls (below 50K) and hot wages. The worst one. Jobs slowing and prices not. Here the Fed is trapped, and the market works it out fast: risk-off, gold waking up, equities suffering with no central bank safety net.

Very weak payrolls and cool wages. The only case where the old “bad is good” reflex comes back: the hawks go quiet, yields fall, and the market starts dreaming of a cut again. But keep an eye on participation, because if the number is weak only because people stopped looking for work, the relief doesn’t last long.

Grid of the four possible payroll scenarios, combining jobs and wages: everything in line, strong and hot, weak and hot, weak and cool, each with the typical reaction of the dollar, yields, gold and equities
The map of typical reactions. Not signals, just the four ways the afternoon can go.

How I handle it

Not much theory, three practical things I learned by paying for them.

I don’t enter on the spike. I don’t trust the first payrolls candle. Widened spreads, slippage, prices going one way and coming back in the time it takes you to read the headline. Whoever hammers in on the first tick gets chewed up and spat out, and I say that as someone who fell for it for years with Swiss punctuality.

I cut size before, not after. And here I’m asking you a favour: if you have a position open that’s still alive on Friday afternoon, before 8:30 do the maths on what you actually lose if the stop goes with double the spread. Not by eye. With numbers. The Lot Size Calculator takes twenty seconds and tells you exactly how many lots you can afford at that stop level. Twenty seconds against the week you ruin: sounds like a fair deal to me.

I watch the second move, not the first. The market reacts to the headline first, then reads the rest (revisions, wages, participation) and makes its real decision. It’s the second move that usually holds.

And then something obvious that still separates the professionals from everyone else: these days should never surprise you. Knowing in advance that a time bomb goes off on Friday at 8:30 is half the job. The macro calendar on Thunder Desk is free, it tells you what’s coming out and how much it weighs, and it saves you from the classic scene of the trade you happened to leave open thirty seconds before the release.

Three things to take away

  1. The “weak data means stocks up” reflex is broken this year. Warsh’s Fed has three dissenters who want to raise rates and the market is pricing a September hike, not a cut. Weak employment with high inflation isn’t relief, it’s one more problem.
  2. The headline is the least informative of the three numbers. Wages, revisions and the participation rate tell you what actually happened. June is the lesson: unemployment falling while 720,000 people stop looking for work isn’t good news, it’s the opposite.
  3. Friday is a day for reduced size and patience. The first candle exists to fool the people in a hurry. You’re not obliged to trade it, you’re obliged to know about it.

Last month the payrolls printed +57,000 and the afternoon was a rollercoaster (here’s how the intermarket moved). Those who had the map in their pocket walked through it. The others just took it.

If you want to practise sitting inside days like this without risking a single real euro, the Events on The Thunder Trader run in a demo environment on forex, CFD and crypto: you go head to head with other traders exactly when the market throws a tantrum. And if you’re starting from zero, the free ebook Win the Arena lays the method out for you.

I’ll stop here. On Friday, before you press any button, ask yourself the right question: not “what’s the number”, but “what is the market already pricing in, and what happens if the number says the opposite”.

The rest is noise.

Suerte Amigo!

Tiziano Brunno

Tradingblog


Disclaimer: purely informational and educational content. It does not constitute financial advice nor an invitation to trade. Trading carries the risk of capital loss.

Fed funds rate path chart showing hold versus hike scenario, July 29 meeting

Fed today: almost nobody expects a move, and that’s exactly where the risk hides

Hi trader,

today is one of those days.

At eight in the evening, our time, the Federal Reserve has its say on rates. And as usual you’ll find the chart sitting flat all afternoon catching its breath, and then in five minutes it does what it hasn’t done in five days.

But let me tell you right away the thing that matters, because it’s counterintuitive.

Today’s decision, most likely, won’t be a surprise. The market takes it for granted that the Fed leaves rates where they are, frozen in the 3.5%-3.75% range. It would be the fifth time in a row it doesn’t touch them.

So the number, the one that ends up in the headlines, we pretty much already know.

Then where’s the risk? In the tone. In what Kevin Warsh says half an hour later, in the press conference, and in how he says it.

Let me walk you through it properly.

Why the decision is almost a non-event

Let’s take it in order.

When something is the most likely outcome, largely priced in, the market has already accounted for it. The dollar, gold, the indices, they’re already positioned for a rate hold. If what everyone expected comes out, the reaction to the number itself is a shrug.

The point is somewhere else. The Fed doesn’t just decide what to do today. It sends a message about what it will do tomorrow. And that message arrives through three channels:

  • the exact words of the statement, where even one changed sentence carries weight
  • Warsh’s press conference, the tone, the answers to the awkward questions
  • the set of projections, when there are any, and today there aren’t: July is a non-SEP meeting, no dot plot, the next projections land in September. Which is exactly why the words matter even more.

That’s where the market moves. Not on “they held steady”, but on “and now what should we expect”.

The context this meeting arrives in

Why is this whole thing delicate? Because the air has changed over the last few weeks, and you’ve seen it on the markets.

Inflation isn’t dead. Oil spiked on the tensions in the Middle East and then dropped just as fast the moment a truce was on the table, over 7% down in a single session on Monday, but it’s still well above where it started the year and it takes very little to send it running again. And more oil means more pressure on prices. Warsh, for his part, hasn’t minced words: he’s repeated that prices are still too high.

And here’s the detail that keeps everyone on edge: at the previous meeting a few members of the committee said they were open to raising rates later in the year. Not cutting them. Raising them.

You get the picture. The market bets they don’t move today, but it’s holding its breath to see how hard the Fed will bang its fist on the table on the “and if we have to, we’ll raise them”.

The three scenarios to keep ready

I’m not handing you entry signals, far from it. I’m handing you the map, so whatever comes out you don’t get caught with your mouth open.

Scenario 1, rates on hold and a soft tone. The Fed leaves everything as is and softens the rhetoric a bit, maybe acknowledges the economy is slowing. This is the scenario the market would greet with relief: dollar down, gold up, some breathing room for the indices. The least likely, given the premises.

Scenario 2, rates on hold but a hard tone. This is the base case. They don’t touch anything, but Warsh holds his ground: inflation still high, the door open to a hike, no rush to ease. Here the dollar stays solid or strengthens, gold struggles, the indices work with the handbrake on. It’s not a bomb, it’s pressure that keeps going.

Scenario 3, the surprise. A surprise hike today, or a tone so aggressive it prices in an imminent hike. Not the base case, but far from remote: the market gives it about one in three. And if it lands it’s a shock: dollar spiking, gold and indices under heavy pressure, sharp risk-off. It’s the high-impact scenario, the one you don’t want to be overexposed to right now.

In practice
It’s not gospel, but these evenings often follow a script: a violent, nervous first reaction to the statement, the market slamming from one side to the other while it digests the words, and only after the press conference does the move take a cleaner direction. Whoever hammers in on the first tick often gets chewed up and spat out in two minutes.

What I’m watching tonight

Little theory, three concrete things.

The words of the statement. Not the decision, the nuances. A sentence removed or added compared to last time says more than a thousand comments.

Warsh’s tone in the conference. He’s the one who moves the dollar, often more than the facts. If he leans on inflation, the message is clear even without touching rates.

The reaction of the dollar and gold in real time. They’re the thermometer. They tell me, minute by minute, whether the market bought it or not. Price is the verdict, the rest are opinions.

And here’s something worth more than any forecast: events like this must not catch you by surprise. A serious macro calendar tells you in advance when the hit is coming and how heavy it is, so you don’t end up with an elephant-sized position open thirty seconds before the announcement. On the Desk you’ve got the calendar with the real impact of every event for free, and it’s the difference between knowing rain is coming and getting caught in the storm in your underwear. No noise, just data.

Three points to take home

  1. Rates on hold are the most likely outcome but not a certainty (the market prices about a one-in-three hike), so the market mover isn’t the number, it’s the tone the Fed wraps around it.
  2. The context is hawkish: sticky inflation, oil whipsawing, and part of the committee thinking about hiking, not cutting. The base case is rates on hold with hard rhetoric.
  3. It’s a high-volatility, false-move kind of evening: reduced size, no heroics on the first tick, and let price hand down the verdict.

July 29 isn’t a day like any other. You don’t have to trade it, you have to know about it. The market isn’t going anywhere: if you don’t have a clear picture, it’ll still be there tomorrow.

If you want to train your reading of these days without risking a single real euro, the Events on The Thunder Trader run in a demo environment, on forex, CFD and crypto: you go head to head with other traders and learn to sit inside the volatility with a cool head. And if you’re starting from zero, the free ebook Win the Arena lays out the method for you.

I’ll stop here. Tonight, before you press any button, ask yourself the right question: what is the market pricing in, and what happens if the Fed says the opposite?

Suerte Amigo!

Tiziano Brunno

Tradingblog


Disclaimer: purely informational and educational content. It does not constitute financial advice nor an invitation to trade. Trading carries the risk of capital loss.