Buying crypto without getting hurt: how much to put in, how much to risk, where to keep it
Hi trader,
the question I get asked most about crypto isn’t “what should I buy”.
It’s “how much should I put in?“
And I always answer with another question: how much are you willing to lose?
That’s where almost everyone stops. Some people laugh. Some answer “nothing, I’m not buying it to lose money”.
Well, the whole problem is in that answer.
Nobody buys to lose. But if you haven’t decided beforehand how much you can lose, you find out the number afterwards. And you risk finding it out from the market, on the worst day.
Last lesson we saw what moves the price. Today we get practical, and the basic rule is just one: first you decide how much you can lose, then how much you buy. Never the other way round.
Ok, vamos.
First of all: look at what it’s capable of
I’m not asking you to guess where it’s going. I’m asking you to look at where it has already been.
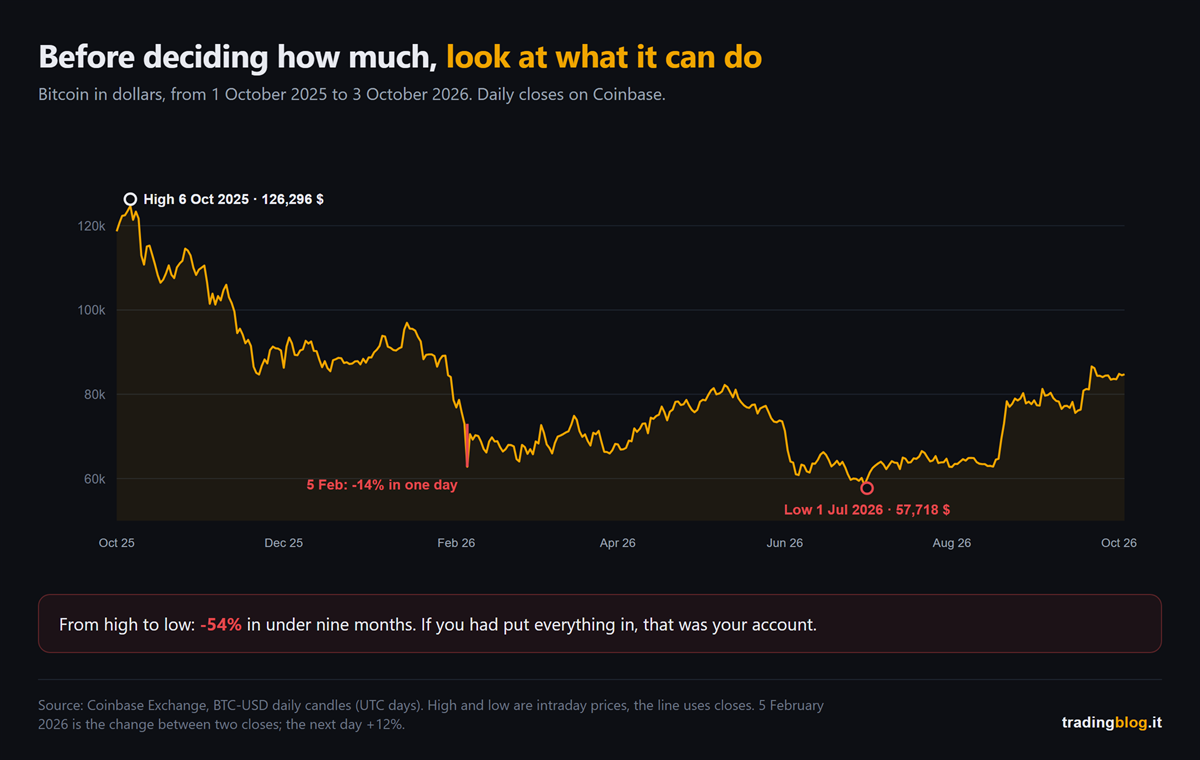
On 6 October 2025, on Coinbase, bitcoin hit 126,296 dollars.
On 1 July 2026 it hit 57,718. Down 54%.
In between, on 5 February 2026, it lost 14% in a single day. And the next day it got back 12%.
I’m not telling you this to scare you. I’m telling you because these numbers are your account, if you put everything in.
If you’d bought at the top with all your capital, by July you’d have had less than half of it. And not because of a mistake in your analysis: just because that’s how bitcoin moves.
Size comes from risk, not from gut feeling
Let me explain it the way we do it on futures, because it works exactly the same.
One. Decide what slice of your capital you’re willing to lose if you’re wrong. A percentage, not a random number. How much it is, that’s your call: it depends on how much capital you have, what you need it for and how well you sleep at night. What matters is that it’s decided beforehand and written down somewhere.
Two. Decide where you’re wrong. Meaning the price at which your idea no longer holds. That’s the stop.
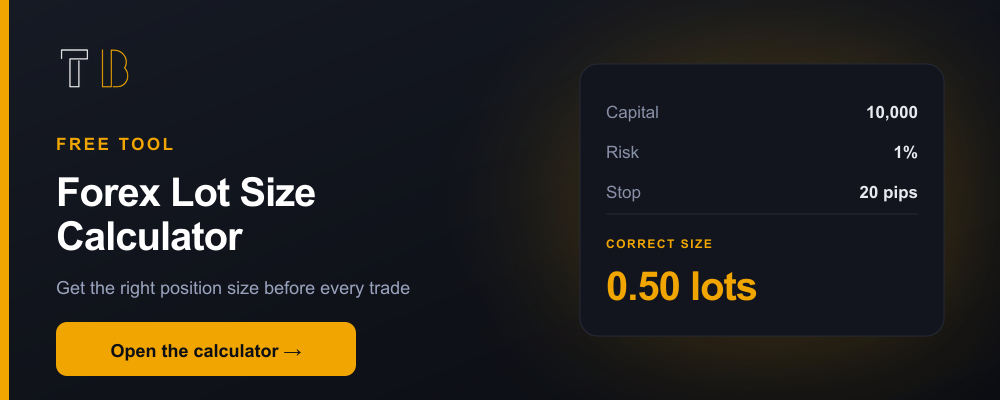
Three. Only now do you work out how much to buy: risk divided by the stop distance. If you measure the distance as a percentage, you get how much the position is worth; if you measure it in dollars per coin, you get how many coins.
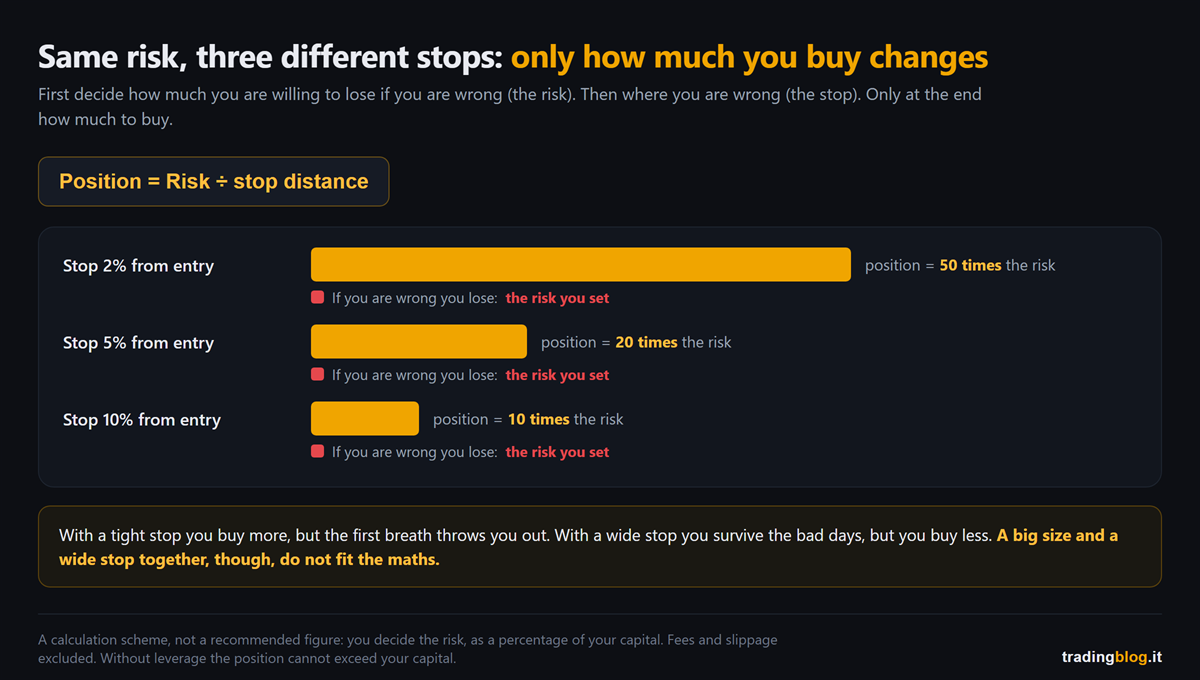
Look at the figure, because here’s the thing almost nobody has clear.
Risking a certain amount doesn’t mean buying that amount. With a tight stop you can buy more, with a wide stop you have to buy less. If you’re wrong, the loss is the same, plus fees and any slippage on the stop.
One limit: without leverage the position can’t be bigger than the capital you have. If the formula gives you a number bigger than your account, that’s not a green light for leverage: it means the stop is too tight or the risk too high.
And go back to 5 February. With a 2% stop you were out at the first breath that day, and the next day price had already got back 12%. With a wider stop you survive days like that, but you have to buy less. A tight stop lets you buy more, but on a market that does 14% in a day it gets hit for nothing. The ones who get wiped out are the ones who keep the big size and then widen the stop, or don’t set one at all.
And what if you buy with no stop, to hold? That’s a legitimate choice. But then the stop distance is the whole way down to zero. And that’s not a textbook hypothesis: the -54% you saw above isn’t the worst of it, between 2021 and 2022 bitcoin lost 77%, between 2017 and 2018 it lost 84%. So the question becomes: if it halves tomorrow, how much of my capital goes with it? That number has to be one you can lose without your life changing.
I’ve been doing this calculation by hand on futures for years. On crypto, with quantities full of decimals and the euro dollar exchange rate in the middle, doing it by hand is how you get it wrong. That’s why we built the Crypto Risk Manager: you enter capital, risk percentage, entry and stop, and it tells you how much to buy. If you use leverage, it also warns you when the liquidation price falls before your stop, meaning when the stop you’ve set will never get hit. It’s free, and it takes thirty seconds. A lot less than it takes to blow an account on a size picked on feel.
I won’t repeat myself on leverage: leverage and liquidations, how you get wiped out. I’ll just tell you that to buy a crypto you don’t need leverage. It’s for people who want to do more with the capital they have, and they pay for that more with the risk of getting out before they’d decided to.
Where you keep what you’ve bought
Size protects you from price. But price isn’t the only way to lose money with crypto.
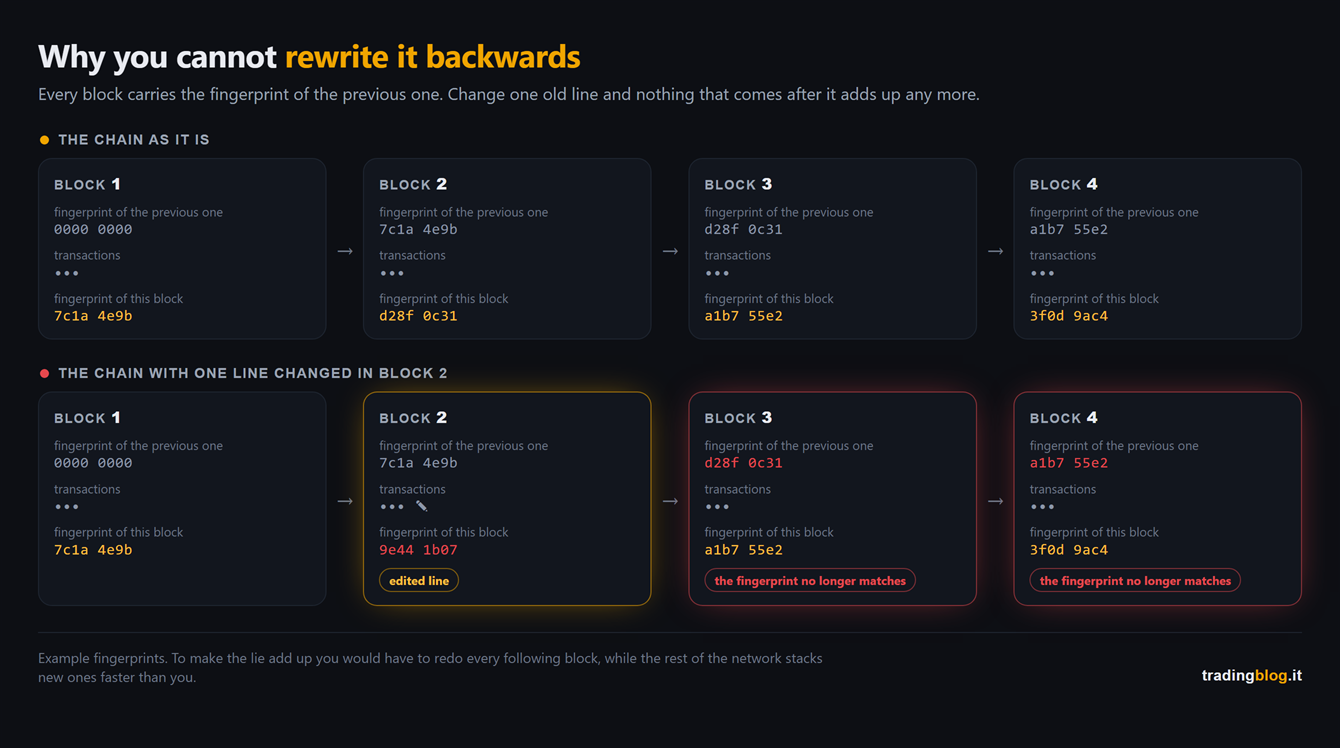
Remember the distinction we’ve been carrying since the first lesson: the ledger is one thing, whoever guards your access to it is another. Nobody has managed to rewrite the bitcoin ledger so far. The ones that get hacked all the time are exchanges, custody services and keys.
If you leave your crypto on the exchange, what you have is a row in its database: it owes you coins. If the exchange goes bust, the problem becomes yours. I covered this properly in the exchange, the place where you buy.
And it doesn’t take a collapse. On 21 February 2025, according to the FBI, around 1.5 billion dollars in crypto was stolen from a big exchange. The blockchain had nothing to do with it: what got hacked was the system the exchange used to sign withdrawals from its own holdings. That time it said it had covered its customers. With FTX, which collapsed in November 2022, the first repayments, for small claims, started in February 2025. And they were calculated in dollars, at the price on the day of the collapse: if you had bitcoin, you got back what it was worth then plus interest, not the bitcoin.
If you send them to an address only you hold the keys to, on the ledger they stay yours and no exchange owes you anything anymore. But with the keys, all the responsibility passes to you. How not to lose them and how not to give them away is in keys and wallets.
Which of the two you choose is your business. But custody is a risk decision just like size, and it has to be made beforehand, not on the day everyone rushes to withdraw.
What you do starting tomorrow morning
Write down the percentage. How much of your capital you’re willing to lose on one trade. One line, before you open the exchange.
Decide the stop before the size. If you don’t know where you’re wrong, you don’t know how much to buy.
Decide who holds the keys before you buy. And if you leave your crypto on the exchange, do it knowing that what you have is a company’s promise.
Where we go next time
Last lesson of the series. We’ve put a limit on what price can take from you, and chosen who you trust with the keys. What’s left is the sneakiest thing of all: the scams that still work. Signatures that authorize someone else to drain your address, fake support, projects that vanish with the money.
How much should I put in is the wrong question. The right one is how much am I willing to lose, and you ask it before you click buy.
Back to the start.
To the people who answer “nothing, I’m not buying it to lose money” I always say the same thing.
Perfect. Then write down how much. Because the market will ask you for that number anyway.
Only, if you didn’t write it down, it picks it for you.
Suerte Amigo!
Tiziano Brunno
Tradingblog
Want to put your market reading to the test?
Compete and challenge other traders inside an Arena in a demo environment, with no real capital at risk. Discover the Performance Arena Events by The Thunder Trader.
Disclaimer: purely informational and educational content. It does not constitute financial advice or an invitation to trade. Trading involves the risk of capital loss.